Characterization of black phosphorus as Microstructured Anisotropic 2D Material by Imaging Mueller Matrix Ellipsometry
Introduction
Thin-film layers of black phosphorus - the most stable allocate of the element phosphorus - is a promising material for future semiconductor electronics based on novel 2D-materials. Ultra-thin films or even monolayers of black phosphorus (b-P) may be fabricated by mechanical exfoliation from bulk material (similar to graphene). 2D-b-P is of particular interest for semiconductor electronics as it features a widely tunable bandgap via the layer thickness (from ~2 eV for monolayers down to 0.3 eV for bulk material). Thus, it closes the energy gap between the other known 2D- materials graphene (zero bandgap) and transition-metal dichalcogenides (bandgap typically 1-2 eV) such as MoS 2.[1]
Regarding its optical properties, b-P stands out from other 2D-materials as well because its crystal structure causes an in-plane optical anisotropy in the visible range of the electromagnetic spectrum. However, the ellipsometric characterization of exfoliated flakes of b-P is extremely challenging as flake sizes are typically on the order of some 10μm, and the thickness often varies within a single flake.
In this work, for the first time we report the ellipsometric characterization of micro-structured b-P-flakes by means of spectroscopic Imaging Mueller Matrix Ellipsometry (IMME). It features much higher x-y-resolution compared to conventional ellipsometers since for IMME this resolution is not limited by the size of the illuminating spot. By using IMME with a microscope objective lens, the measurement of anisotropic refractive indices and the orientation of the optical axes comes feasible even on microstructured thin-film samples such as b-P-flakes.
Imaging Mueller Matrix Ellipsometry θ-scans
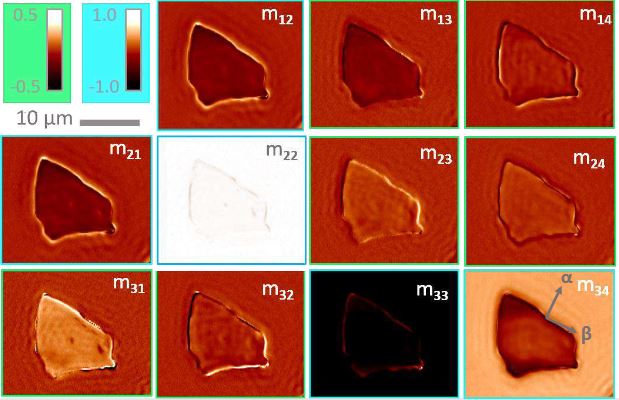
- non-zero off-diagonal blocks of MM-micrographs reveal the b-P-flake’s anisotropy (wavelength of illumination λ=550 nm)
- θ-scan: rotate the flake around its center point & record MM-micrographs at each position (rotation from 0° to 340° in 20°-steps)
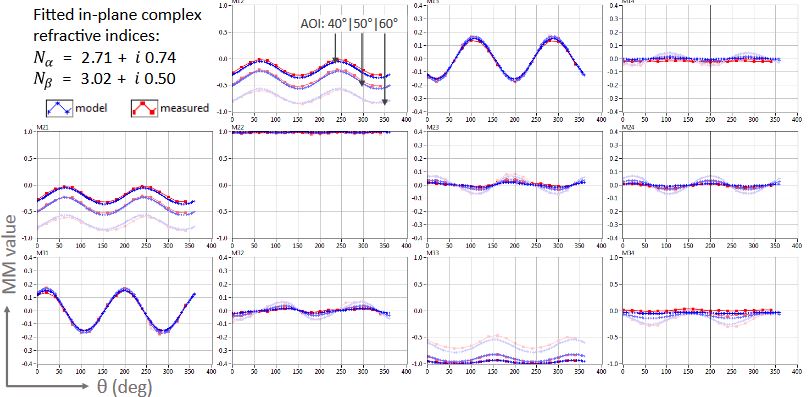
- evaluating central region of interest (ROI, c. fig. right) on each MM-micrograph for all θ-positions yields Mueller-Matrix θ- spectrum
- observed periodicity of 180° complies with an orthorhombic, biaxial model for b-P (one axis orthogonal to the sample surface)
- using the flake thickness obtained from AFM-measurements (43 nm) for optical modeling yields the in-plane refractive indices and the orientation of the in-plane principal axes of the index ellipsoid.
MM-micromaps of black phosphorus (MM-element m 31, λ=550 nm) at different rotational angles θ: MM- value changes due to in-plane anisotropy
Micromaps of normalized MM (m11=1) at θ=0° and λ=550 nm. Mind different scale bars for block diagonal (blue frames) and block off-diagonal (green frames) matrix elements. Arrows in m34-graph indicate the orientation of in- plane optical axes obtained from ellipsometric modelling of θ-scan.
θ-spectrum of the normalized 3x4 MM of black phosphorus at different angles of incidence obtained from ROI-evaluation of MM-micromaps. Indices of fitted complex refractive indices and refer to principal in-plane axes of index ellipsoid (c. figure left, inset in m 34-micrograph). Mind different y-scales for block diagonal and block off-diagonal MM-element.
AFM measurements
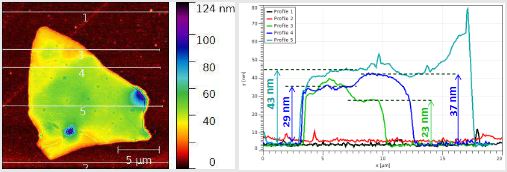
- atomic force microscopy (AFM) topography measurements yield layer thicknesses d of different parts of the flake.
- statistical analysis of central region (circular mask, c. image right): d = 43 ± 3 nm.
- line profiles yield approximate thicknesses of different plateaus
AFM measurements were carried out at University of Goettingen by Ann
Topography image obtained from AFM measurements (left) and horizontal line profiles with derived layer thicknesses (right)
Summary
A microstructured flake of exfoliated black phosphorus was characterized by means of Imaging Mueller Matrix Ellipsometry (IMME). The flake-size was below the x-y-resolution limits of conventional ellipsometers. Thus, IMME is a technique to extend Mueller-matrix analysis of anisotropic 2D-materials to microstrucured samples.
MME-θ-scans:
- non-zero off-diagonal MM-blocks of b-P-flake (MM-micromaps) reveal the anisotropy of thin-layer flake
- recorded θ-scans were successfully modeled by assuming a simple orthorhombic crystal structure with biaxial anisotropy for b-P-layer with one axis orthogonal to the sample’s surface
- in-plane complex refractive indices and orientations of in-plane optical axes were obtained for a single wavelength (λ=550 nm) from fitting the model to IMME-θ-scans for three different angles of incidence using predetermined layer thickness (AFM) and real refractive index in z-direction
- in-plane fit results are almost independent of refractive index in z-direction
pectroscopic IMME:
- once having found an ellipsometric model and in-plane orientations of optical axes obtained from IMME-θ-scans, a spectroscopic IMME measurement yielded the optical dispersions of in-plane components of b-P for the wavelength-range of 480-690 nm (assuming constant real refractive index for z-direction)
- MM raw data and fitted dispersions both revealed significant reduction of in- plane anisotropy for spectral range of 600-700nm
- Obtained dispersions might still depend on assumed value for refractive index in z-direction. Additional data at different AOI or sample rotations θ might decouple in-plane and out-of-plane refractive indices upon numerical analysis.
References
[1] A. Castellanos-Gomez, J. Phys. Chem. Lett., vol.6, no.21 (Nov. 2015)
[2] A. Castellanos-Gomez et al., 2D Materials, vol.1, no.2 (June 25, 2014)


