Phase Separation in the Co-Extruded Polymer
Instability Flow in the Multi-Layered Copolymer
Force Modulation Microscopy (FMM) is one of the unique AFM modes that is gaining more popularity. This technique is useful to identify composite or blended materials that have different phases.
Specifically, FMM creates images based on the mechanical properties of the sample surface such as hardness and viscosity. It operates in dynamic contact mode by applying an adjustable frequency oscillation to the probe. As the probe tip contacts the sample surface, the probe deflection is detected by measuring the vertical movement and shift in the phase angle . The oscillation amplitude of the probe is reduced with increasing surface hardness. Surface topography images can simultaneously be obtained along with the phase information. Based on the configuration of FMM mode, we can obtain three images in one scan: topography, amplitude, and phase.
Multilayer structures were prepared by co-extrusion technology using a feedblock with a multiple layered element. Polycarbonate (PC) and polypropylene (PP) were extruded to form alternating structures by repeated layer multiplications using multiplying elements.
Microstructure images were taken of copolymers consisting of 80% PP and 20% PC in the form of composites. It is a good sample for identifying the interface of phase instability and composition in the multilayer using the XE-series AFM.

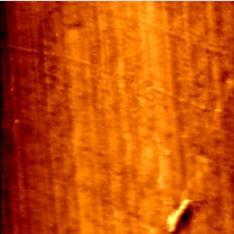
Figure 1. AFM image of a co-extruded film taken with the XE-150 (90 μm scan size). This image shows no phase information. Image Courtesy of Dr. Jun Seok Lee and Prof. Changmo Sung, Univ. of Mass., Lowell.
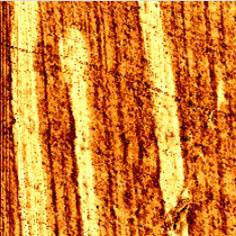
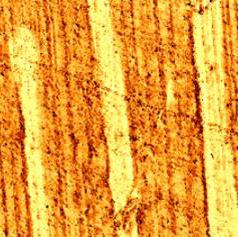
Figure 1 shows the topographical information. In FMM mode, the amplitude map shows the elastic properties of the sample which is shown in Figure 2. Figure 3 displays the phase image which indicates energy dissipation.

Figure 2. FMM amplitude image of a multi-layered structure of PP and PC taken with the XE-150 (90 μm scan size).
Contrast in the phase image is a typical feature of the oscillating cantilever phase shift. This contrast is explained by the dependence of the phase shift on the surface properties. The phase shift is affected by surface geometry, adhesion, and viscosity. The phase image is capable of identifying a surface region with different properties. In the composite material, the lighter regions in Figure 3 correspond to a greater phase shift for the 20% polycarbonate.

Figure 3. FMM phase image of a multi-layered sample of PP and PC taken with the XE-150 (90 μm scan size). The thickness of each layer ranges between 5 μm to 9 μm.
The XE-series AFM can be easily used to detect these phase separations due to stiffness and energy dissipation. The user-friendly interface enables precise operation and gives you the freedom to control operational parameters.
