Effortless AFM data analysis with Park SmartAnalysis
Research Application Technology Center
With the successful launch of SmartScanTM, we at Park Systems developed an AFM operating software that set new standards for nanoscale measurement, productivity, and efficiency. Motivated by a continuous aspiration to make high-precision data quickly and consistently, we now present our powerful yet easy-to-use AFM data analysis platform – Park SmartAnalysisTM. The pioneering SmartAnalysis revolutionizes redundant and complicated analysis procedures of AFM data and transforms time-consuming tasks into simple mouse clicks. The software is built to fulfill the requirements of all user levels based on a friendly interface along with a full set of comprehensive functions and parameter settings. Park SmartAnalysisTM allows for higher functionality, faster throughput, and eliminates common errors to provide consistent, accurate, and repeatable AFM data analysis.
The complexity of AFM data analysis
AFM technology is powerful and versatile. However, the complex nature of this methodology has hindered its mass adoption in various fields of science and engineering. In particular, difficulties associated with AFM data analysis originate from several issues:
• AFM is a scanning probe technique that yields a multi-dimensional array of sample information at each scanned data point (image pixel). Specialized software is required for AFM data reading and analysis.
• Nanoscale measurements are prone to even minor experimental misalignments and external noise sources, affecting the final image quality. Image processing and correction routines are required to acquire accurate sample information before the final data presentation. Choosing the proper image processing operators and parameters can be challenging and vary for different applications and measurements.
• The user interface of conventional AFM data analysis software is complicated and typically requires hours of training and use to become proficient. Image processing is often performed using a time-consuming trial-and-error approach to determine the proper final parameters. Once the proper workflow is determined for a single image, it can be manually applied to the rest of the dataset. For large amounts of data, this repetitive procedure is slow and tedious.
• Decreased productivity and developing new application-specific routines can be an expensive hit to analytical throughput and total operational costs.
Customized analysis for everyone
robust data analysis capabilities. The software interface is designed with the user experience level in mind. For novice users, automated analysis functions are available for fast and accurate data processing. On the other hand, we also offer complete control of functions and parameter settings for advanced users who prefer precise and specific control of analysis functions, and do not want to rely on “black boxes” or standard solutions.
User-friendliness as a core value of SmartAnalysis™
Park Systems’ software is designed for users to familiarize themselves with the platform with limited training requirements, thus minimizing the efforts required for adopting and implementing the AFM methodology. The new SmartAnalysis accommodates some critical improvements for enhancing usability:
• The function guide helps first-time operators get used to the software modules and functions.
• A navigation bar with embedded image information enables a general outlook and navigation through the data. This is especially helpful when working with many images.
• The layer function allows details control and modification of all analysis processes applied to the data.
• The analysis history function snapshots each step in the workflow and allows undo/redo toggling at your convenience.
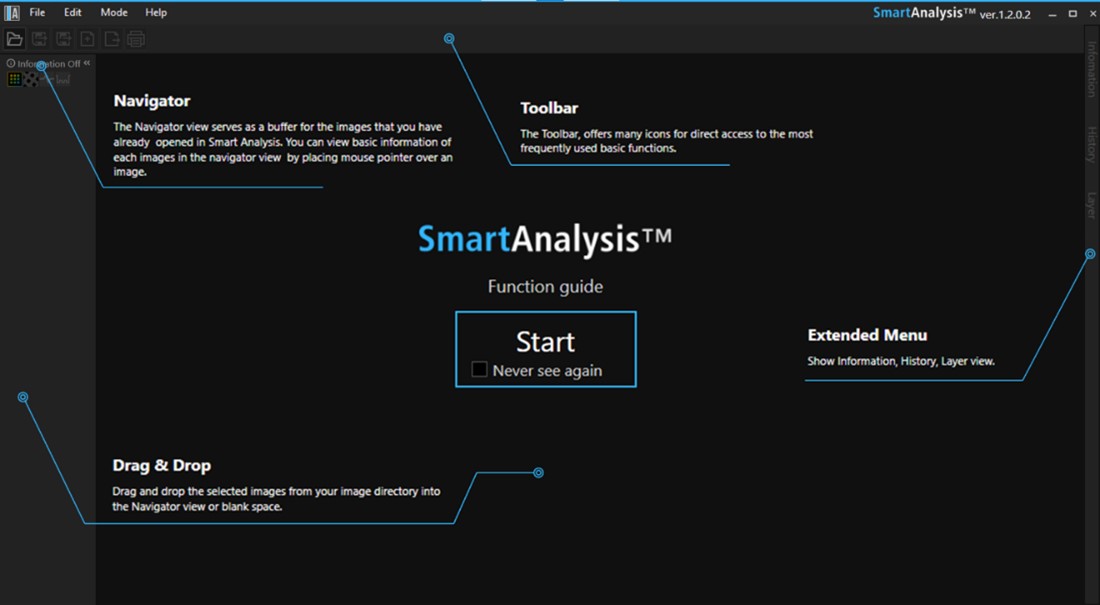
Figure 1. Startup screen of Park SmartAnalysis. A function guide helps introduce first-time users to the modules and functions of the software.
Effortless data flattening with Park Systems’ exclusive EZ Flatten™
Flattening is a critical process required to level the slope of a sample surface and reveal the correct surface topography. However, it can be one of the most complicated data processing steps in AFM data analysis. Incorrect flattening parameters can distort the real data, leading to an erroneous conclusion if not properly interpreted and understood, as presented in Fig. 2.

Figure 2. Example of surface distortion due to improper flattening parameters. Typical AFM topography data has a surface slope due to sample mounting. Depending on flattening parameter settings (whole/line flatten, regression order, reference area, etc.) actual data can either be correctly processed or altered.
Park Systems’ exclusive EZ Flatten is a machine learning-based function designed to reduce time and effort in processing AFM data and only requires one simple click. The function automatically distinguishes the topography features from the substrate and applies an appropriate flattening algorithm. The operator just needs to load the raw data and then execute the function. Users can select the best result among six output images recommended, as displayed in Fig. 3.
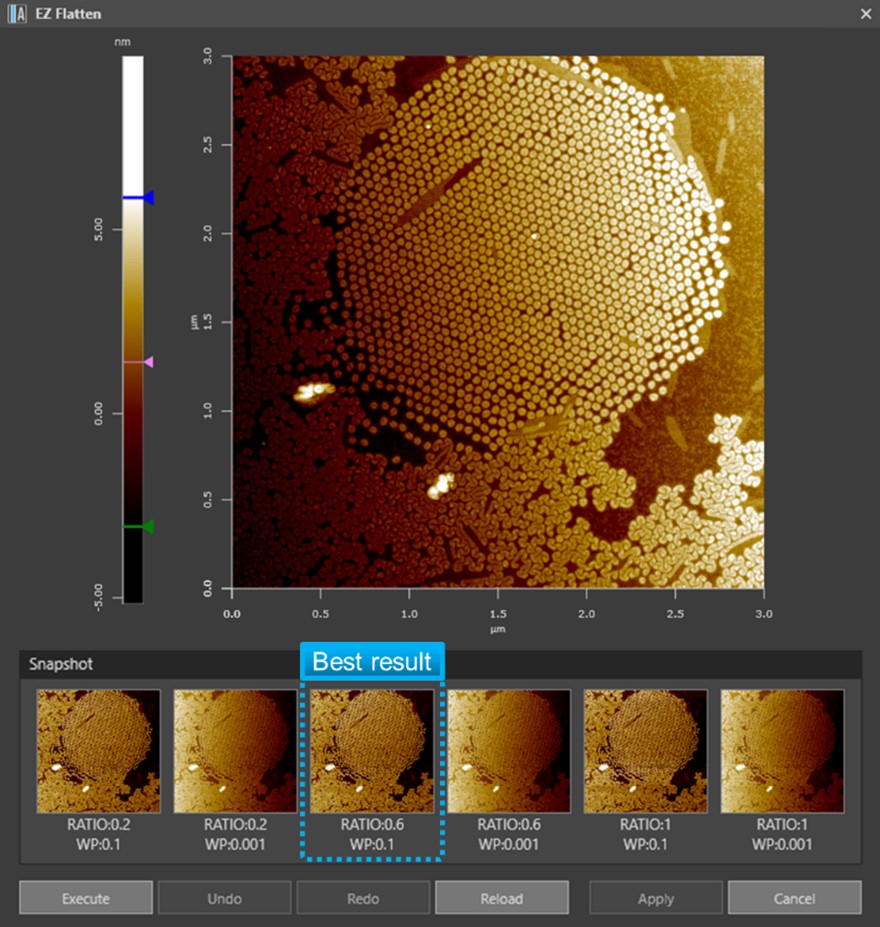
Figure 3. Screen capture of Park EZ Flattening function. Up to six combinations of flattening parameters can be applied. Snapshots allow users to select the most appropriate result.
Supports various data analysis capabilities for academic and industry users
A large variety of features supports customized analytic tools organized in image analysis using the Image mode. Various data processing options are bundled in Spectroscopy mode. Moreover, custom-developed features to analyze profiler data can be applied using the Profile mode. Thus, SmartAnalysis™ helps optimize the workflow for every operator, from academic researchers to quality engineers in industrial facilities.
Image mode:
• Image zooming and panning provide a quick data overview.
• Support of single and multiple line/region analyses and comparisons such as surface roughness, surface step, and angle analyses
• Basic and advanced analysis functions are available, including image processing functions, grain detection, and power spectral density analysis.

Figure 4. Screen capture of SmartAnalysis Image mode. All analyses are logged into a history profile that allows undo/redo at every step.
Spectroscopy mode
• Batch analysis of mapping and multiple point spectroscopy data from various electrical and mechanical modes
• Force spectroscopy data analysis based on contact mechanics models to extract mechanical information from the sample
• Spectroscopy data processing functions such as offset adjustment, force constant and sensitivity corrections, and data filtering
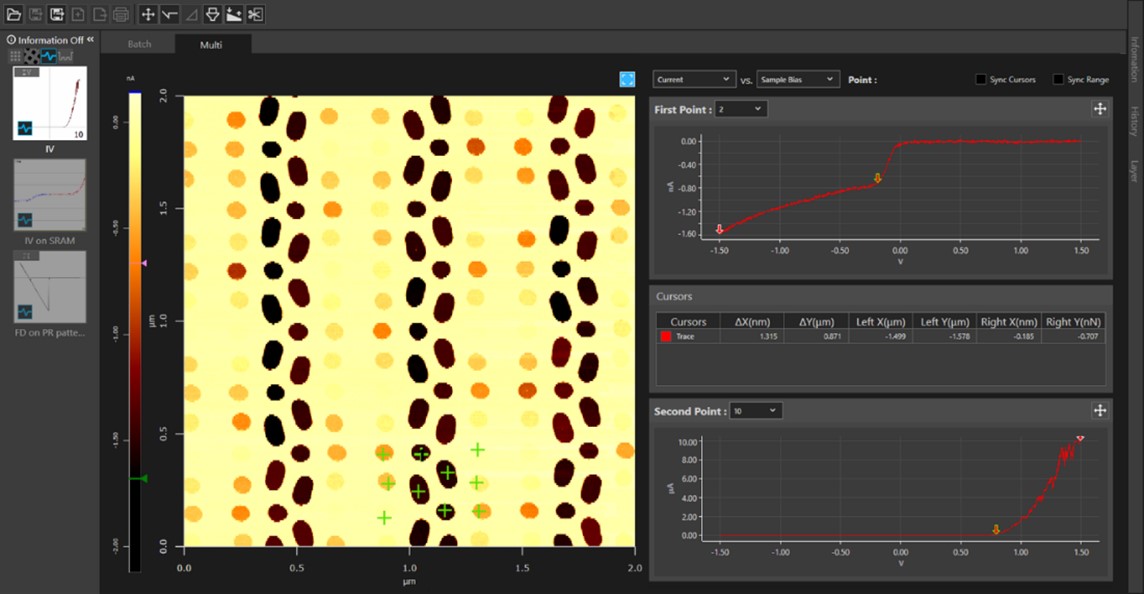
Figure 5. SmartAnalysis Spectroscopy mode supports various mechanical, electrical, and electrochemical data analyses.
Profile mode
• An analysis mode designed to process atomic force profiler data
• Embedded custom-developed functions to assist chemical mechanical polishing (CMP) metrology
• Supports line analysis and statistics, CMP percentile, and CMP histogram analyses
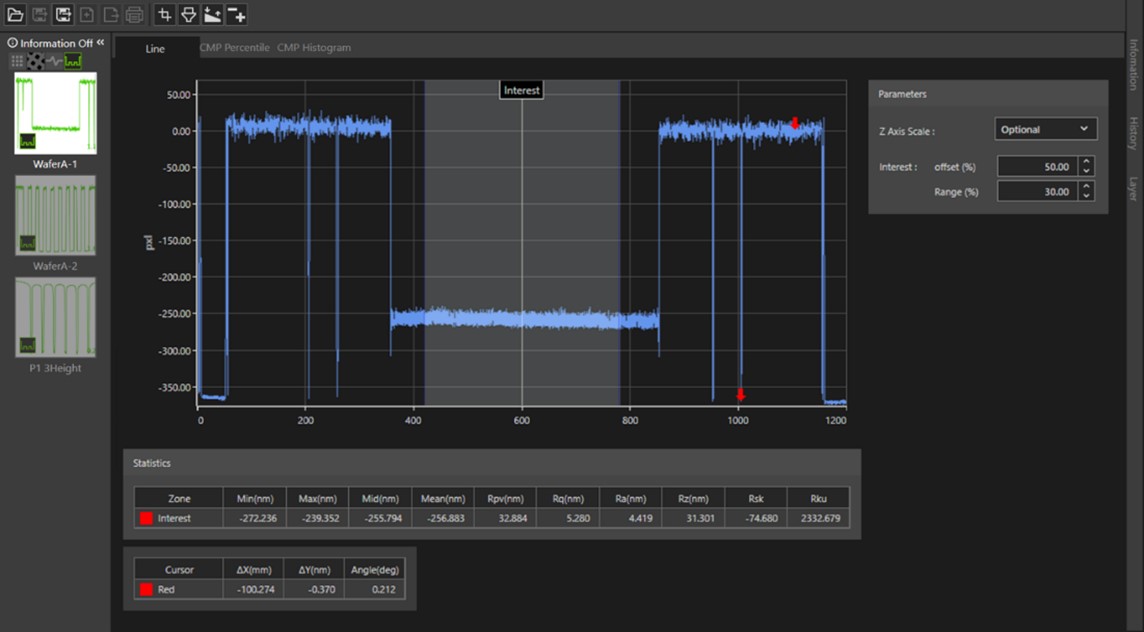
Figure 6. SmartAnalysis Profile mode supports atomic force profiler data analysis.
Data presentation
• A ready-to-publish data export that meets journal publication quality requirements without the need for further modification
• Supports 2D, 3D, and 3D overlay images of different data channels for more intuitive data visualization
• 3D presets simplify parameter settings while keeping consistency between multiple image files, allowing for easy side-by-side comparison
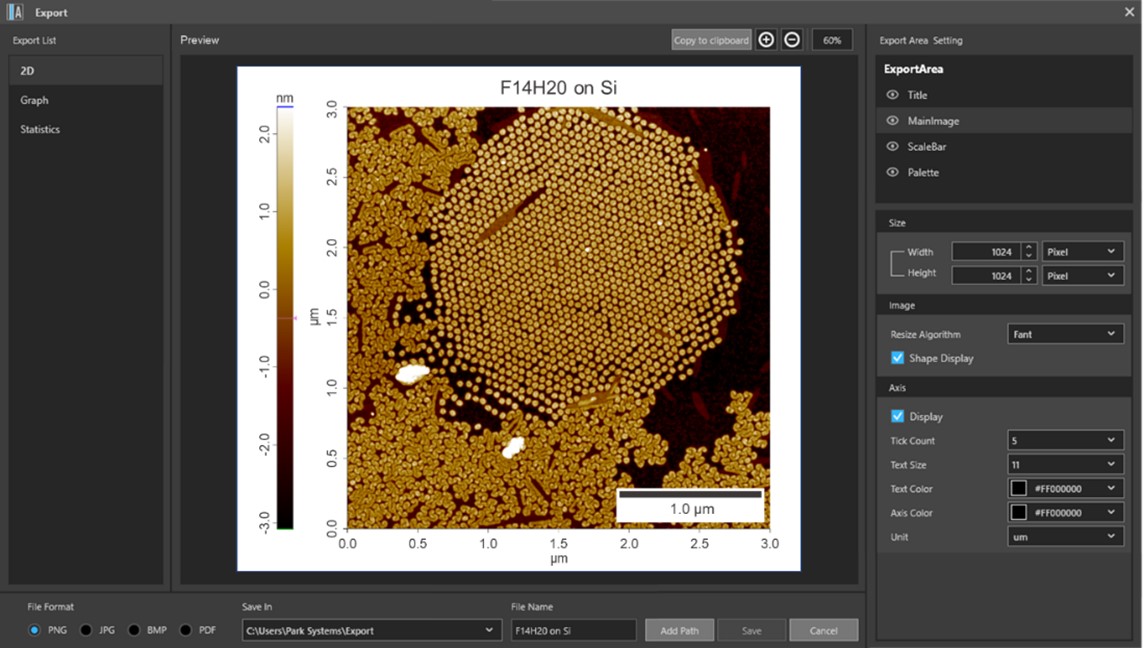
Figure 7. SmartAnalysis supports data export with journal publication quality.
Beyond boundaries innovation
Park Systems never stops innovating and producing customer-driven products. We are constantly listening to address our customers’ changing needs to best support their research. Along with SmartScan™ and SmartLitho™, the release of SmartAnalysis™ is further evidence of Park Systems’ dedication to enabling nanoscale advances across various scientific and engineering disciplines. Work smarter with SmartAnalysis™!
