Live Cell Investigations with AFM and SICM for Biotechnology Advancements
Introduction
Cells are the basic building blocks of all organisms. If several cells of one kind interconnect with each other and perform a shared function, they are referred to as a certain tissue. The interplay of different tissues can form an organ and several organs make up an organ system. Accordingly, to investigate the functional principle of a living organism, it is essential to examine the interactions among individual cells and molecules within these cells [1].
Atomic force microscopy (AFM) and scanning ion conductance microscopy (SICM) are among the leading techniques for exploring the nanoworld. In contrast to optical microscopy, AFM and SICM allow for imaging with nanometer resolution while also proving quantitative 3-dimensional information about the surface topography. Moreover, in contrast to electron-beam-based techniques, AFM and SICM can operate in physiological conditions enabling the investigation of living cells and their dynamic changes as a response to changed environmental conditions. By enabling a physical interaction of a scanning probe with the target sample, AFM can record so-called force-distance (FD) curves that provide nanomechanical information on a local scale. Park Systems’ PinPoint™ nanomechanical mode for example quantitatively maps topographic features as well as the local adhesion, stiffness, or modulus, while being up to ten times faster than traditional force volume measurements. Accordingly, correlating topographic features with nanomechanical information might open up numerous new possibilities in the field of biotechnology and allow to shed light even on the time-dependent dynamics of biological systems.
In addition, SICM enables researchers to image without any physical contact between a probe (nano-pipette) and a sample in liquids and thus permits destruction-free visualization of even the softest samples as hydrogels, soft macromolecules, or biological structures such as neuronal structures and surface cell organelles.
In this application note, we present a fundamental investigation of live cells using AFM and SICM. The successful imaging of live cells depends on their stability and health which motivated Park Systems to develop a live cell chamber integrated within an AFM which provides a conducive environment for both short- and long-term measurements. Using SICM, we applied a non-invasive and destruction-free approach to image the morphology of very soft live cells and monitored any changes over time through consecutive measurements. Meanwhile, the PinPoint nanomechanical mode was employed to map the mechanical properties and morphology of live cells simultaneously.
SICM
SICM was developed by Hansma et. al. in 1989 [2] as a specialized scanning probe microscopy technique for investigating biological systems in a non-invasive approach to provide topographic information of soft non-conducting samples, such as cell membranes under physiological conditions [3], [4]. Unlike AFM, which uses a sharp and rigid silicon tip with a tip radius of less than 10 nm, SICM adopts a nano-pipette with an inner diameter of approximately ~100 nm, as shown in the simple schematic view of SICM presented in Figure 1a. While SICM cannot offer the same spatial resolution as most AFM tips, it uniquely enables stable non-contact measurements in liquids without damaging soft samples. The measurement principle of SICM is based on monitoring changes in ion current between two electrodes while applying a potential. One electrode is placed inside the pipette while the other one, the so-called bath electrode, is submerged in the electrolyte solution in proximity to the sample. Both electrodes are typically silver/silver chloride (Ag/AgCl) electrodes which provide a stable electrochemical potential over a wide range of pH values. With decreasing distance of the pipette to the surface, the diffusion of ions between the pipette aperture and the surrounding solution becomes increasingly obstructed leading to a decreasing current flow. Hence, this current signal from the bath electrode to the pipette electrode is recorded and serves as feedback control to scan the surface at a safe distance from the pipette. Accordingly, this measurement is achieved without any physical contact between the nano-pipette and the sample. Such non-contact imaging is particularly valuable for imaging soft biological samples like live cells. These features enable the functional and physiological studies of live cells [5-7].
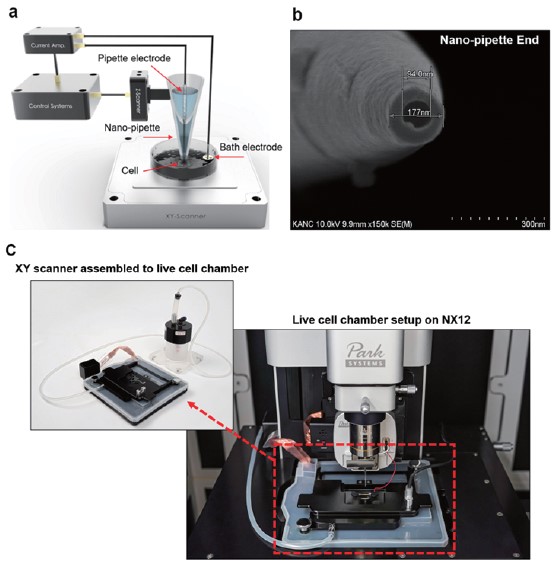
Figure 1. The schematic view of SICM (a), SEM image of nano-pipette end (Inner diameter: ~100 nm) (b) Live cell chamber setup on NX12 (c).
When monitoring dynamic changes to the surface of a living cell in real time, a specific environment is needed to provide optimal conditions for the survival of the cell. The live cell chamber was designed to provide control over environmental factors like the temperature (range: +3 ~ 70℃), CO2 concentration (range: 1 ~ 20%), and relative humidity of the environment (Figure 1c).
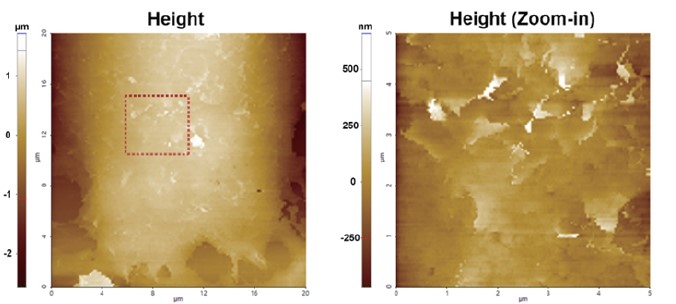
Figure 2. Live cell (Human fibroblast cell) surface imaging by SICM. Image size: 20 μm x 20 μm (left), 5μm x 5 μm (right)
In the first experiment, the surface of a live human fibroblast cell was imaged with SICM after the environment of the live cell chamber was set to a temperature of 37°C, 5% CO2 concentration, and ~99% humidity (Fig. 2). Periodical sensor within the cell chamber readings confirmed stable conditions during a time window of 20 min which was reflected by no noticeable changes to the cell morphology throughout the 20 min measurement period.
In a subsequent set of measurements, long-term observations of live cells were performed. In live cell studies, it is common to observe surface changes caused by chemical or biological agents or changes in the physiological condition over a long period of time so that, the effect of the target stimulations on the live cell can be investigated. In this measurement, the changes of two adjacent live cells were measured over time in an insufficient cell culture medium (cell culture medium and PBS were mixed in a ratio of 1:9). A total of 19 SICM images were repeatedly measured at the same location for 152 min at 8 min intervals. In Figure 3, the edges of the cells, which seemed to be connected in the beginning, started to move away from each other and disconnect entirely after 30 min. Generally, cells form stable bonds over time, particularly if they are of the same type or if they express compatible cell adhesion molecules that can interact and form strong adhesive contacts. On the other hand, when cells are exposed to a severe environment, their behavior is altered. When a cell culture medium is insufficient, meaning that there are not enough nutrients, growth factors, or other essential components present to support the growth and survival of the cells, the cells start to compete for the available nutrients and resources in the medium. This competition can lead to slower growth rates and decreased viability of the cells, as they are not receiving enough nourishment to maintain their metabolic functions. Then, the cells start to detach from each other and the culture dish surface, as they no longer have sufficient adhesion molecules or signaling cues to maintain their attachment.
If the cells are not stimulated or manipulated in any way, the repeated SICM measurements are likely to show little change over time. However, if the cells are exposed to external stimuli or undergo changes in their physiological state, the SICM measurements reveal differences in their surface topography.
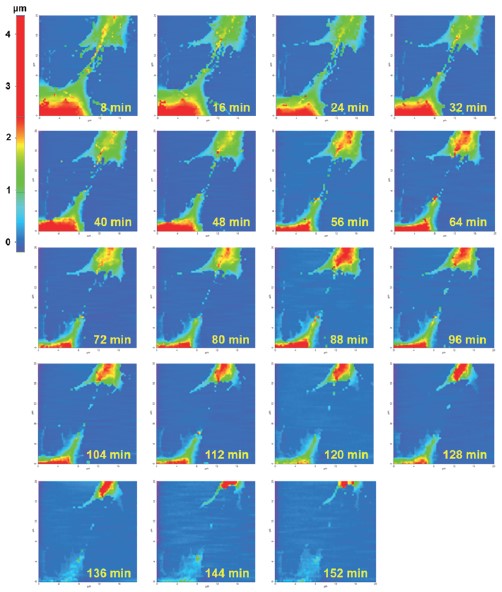
Figure 3. Time-lapse imaging of two live cells edge. 19 SICM images, at the same location for 152 min at 8 min intervals. Image size: 20 μm x 20 μm.
PinPoint™ nanomechanical mode
While AFM is best known for imaging the sample surface with high resolution, it also can measure the mechanical properties such as Young’s (elastic) modulus and adhesion force of a sample using FD spectroscopy mode [8], [9]. In imaging modes, the AFM tip scans over the sample surface to produce a three-dimensional (3D) image of the surface. In force-distance spectroscopy mode, for each pixel, the tip moves directly toward the sample by approaching via the Z scanner. The interaction between the tip and sample is monitored via the cantilever deflection which is converted to units of force (Figure 4a). After establishing a physical contact and reaching a defined setpoint force (approach curve, red line), the cantilever is retracted until the cantilever detaches from the surface (Retract curve, blue line). From such a FD curve, mechanical properties can be obtained like Young’s modulus, adhesion force and energy, stiffness, and deformation (Figure 4b).
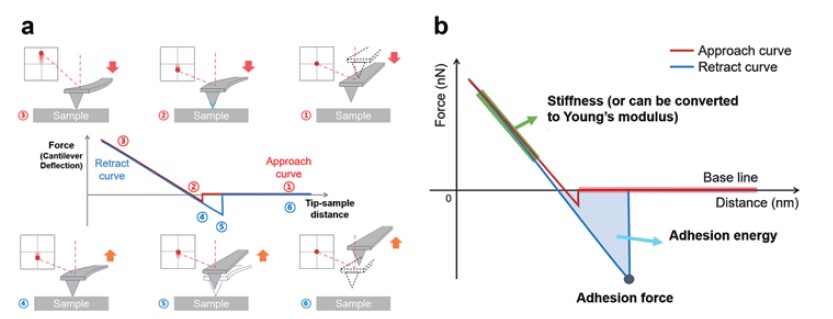
Figure 4. Sequence of force-distance spectroscopy (a) and mechanical properties from FD curve (b).
Park Systems’ PinPoint nanomechanical mode provides quantitative nanomechanical images with well-defined control of contact force and contact time between an AFM tip and a sample via conducting fast FD spectroscopy for each pixel of an image while avoiding any lateral shear forces.
There are several considerations for measuring the mechanical properties of a live cell using the PinPoint nanomechanical mode. First, since live cells are very soft and delicate, a soft cantilever (spring constant: < 0.1 N/m) should be used. Second, the force applied to the sample (setpoint) and scan speed must be optimized. If you press too hard or scan too fast, the surface of the live cell can be easily destroyed and the desired result cannot be obtained. Additionally, the AFM tip may also be contaminated with debris from the surface of the live cell. Conversely, if you press too weakly or measure slowly, the measurement signal itself is not observed.
Figure 5 shows an example of PinPoint nanomechanical mode images (height and Young’s modulus images) on a live cell (human fibroblast cell). This measurement is the result of randomly selecting two regions of a single live cell and shows the distribution of Young's modulus according to the morphology of the live cell. The AFM probe was calibrated for accurate quantitative analysis prior to the measurements. The average values of Young's modulus of the center (Area 1, nucleus) and edge (Area 2, cytoplasm) of the cell were calculated in the Young's modulus image, Region 1: 24 kPa, 6 kPa, and Region 2: 18 kPa, 5 kPa, respectively. In other words, the nucleus area formed a structure about three times stiffer than the cytoplasm area. The nucleus is enclosed by a double membrane called the nuclear envelope, which is supported by a network of intermediate filaments called nuclear lamina. The nuclear lamina provides structural support and maintains the shape of the nucleus. It is composed of proteins that are more rigid and resistant to deformation compared to the cytoplasmic proteins, which contribute to the higher modulus of the nucleus. The red arrow indicated a Young's modulus higher than MPa level, which was affected by the substrate, where a much higher Young's modulus than the cell area could be observed.
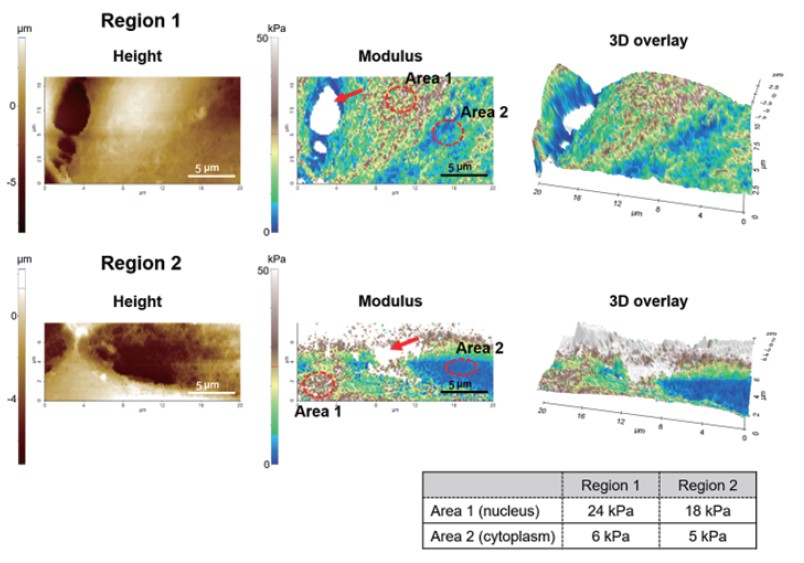
Figure 5. Height and Young’s modulus images of the live cell by the PinPoint nanomechanical mode. The area 1 (nucleus) shows about three times higher Young's modulus than area 2 (cytoplasm).
Figure 6 shows the mechanical properties images at the region where the two cells interconnect. Among the mechanical properties that can be obtained with the PinPoint nanomechanical mode, Young's modulus, deformation, and adhesion force information are displayed along with the height image. By clearly showing the contrast in mechanical properties on a very soft surface of several or tens of kPa [10], it fully demonstrates the possibility of live cell study using the PinPoint nanomechanical mode. Young's modulus and deformation results provide information about the distribution of stiffness in the measurement area. These properties on live cell surfaces offers understanding about cell health, differentiation, response to mechanical stimulation, disease processes, and the effects of drugs or compounds adhesion. Also, adhesion force on the surface of live cells can provide information on cell-cell or cell-substrate interactions [11]. By analyzing adhesion information on live cells, changes in adhesion molecule expression, adhesion strength, or cell behavior that are associated with disease progression can be identified.
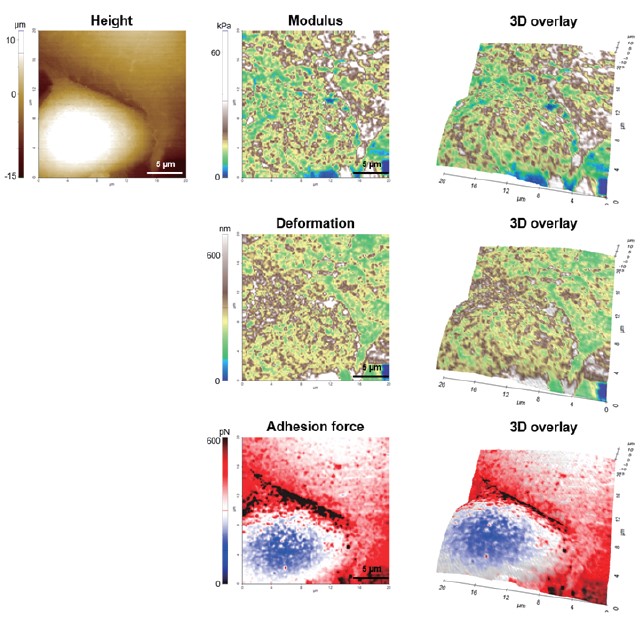
Figure 6. Available mechanical properties channels by PinPoint nanomechanical mode on the live cell. Image size: 20 μm x 20 μm.
Conclusion
Live cell investigations are a fundamental and crucial field in biological research. It is important to establish a proper environment in which live cells can survive so that the desired results can be obtained. SICM/AFM experiments with the live cell chamber enable the study of live cells in a reliable measurement environment. SICM can image the live cell surface without any deformation, and PinPoint nanomechanical mode AFM combines live cell surface topography and mechanical properties mapping together, enabling in-depth study of live cells.
References
1. Hynes, R. Integrins: A Family of Cell Surface Receptors. Cell 48, 549-554 (1987).
2. Hansma, P. K., Drake, B., Marti, O., Gould, S. a. & Prater, C. B. The scanning ion-conductance microscope. Science (New York, N.Y.) 243, 641-643 (1989).
3. Miragoli, M. et al. Scanning ion conductance microscopy: a convergent high-resolution technology for multi-parametric analysis of living cardiovascular cells. Journal of the Royal Society, Interface / the Royal Society 8, 913-925, doi:10.1098/rsif.2010.0597 (2011).
4. Rothery, a. M. et al. A novel light source for SICM-SNOM of living cells. Journal of microscopy 209, 94-101 (2003).
5. Korchev, Y. E., Bashford, C. L., Milovanovic, M. & Vodyanoy, I. Scanning Ion Conductance Microscopy of Living Cells. Biophysical journal 73, 653-658 (1997).
6. Happel, P. & Dietzel, I. D. Backstep scanning ion conductance microscopy as a tool for long term investigation of single living cells. Journal of nanobiotechnology 7, 7-7, doi:10.1186/1477-3155-7-7 (2009).
7. Happel, P., Thatenhorst, D. & Dietzel, I. D. Scanning ion conductance microscopy for studying biological samples. Sensors (Basel, Switzerland) 12, 14983-15008, doi:10.3390/s121114983 (2012).
8. Cappella, B. & Dietler, G. Force-distance curves by atomic force microscopy. Surface science reports 34, 1-104 (1999).
9. Butt, H.-J., Cappella, B. & Kappl, M. Force measurements with the atomic force microscope: Technique, interpretation and applications. Surface science reports 59, 1-152 (2005).
10. Kim, S. O., Kim, J., Okajima, T., & Cho, N. J. (2017). Mechanical properties of paraformaldehyde-treated individual cells investigated by atomic force microscopy and scanning ion conductance microscopy. Nano convergence, 4(1), 1-8.
11. Maître, J. L., & Heisenberg, C. P. (2011). The role of adhesion energy in controlling cell–cell contacts. Current opinion in cell biology, 23(5), 508-514.
