Nanomechanical Properties of Lipid Vesicles Using Atomic Force Microscopy
Gabriela Mendoza, Ph.D., Park Systems Mexico.
Introduction
The unique structures of liposomes – lipid vesicles (spherical structures with a bilayer membrane) of varying size and structural complexities within other lipid vesicles – have been utilized to serve as a drug delivery mechanism over an extended period of time [1]. In this study, a Park NX10 Atomic Force Microscope (AFM) is used to differentiate organic material from a substrate using True Non-Contact™ and Tapping, and to quantify nanomechanical properties using PinPoint™ mode.
Biological membranes define cell boundaries as well as any cell compartment. To some extent, the functionality of membranes is related to the elastic properties of the lipid bilayer and the mechanical and hydrophobic matching with functional membrane proteins. In general, membrane dimensions and mechanical properties (i.e. bilayer thickness, bending and stretching stiffness/membrane tension) modify the function of any membrane protein [2].
Biological membranes define cell boundaries as well as any cell compartment. To some extent, the functionality of membranes is related to the elastic properties of the lipid bilayer and the mechanical and hydrophobic matching with functional membrane proteins. In general, membrane dimensions and mechanical properties (i.e. bilayer thickness, bending and stretching stiffness/membrane tension) modify the function of any membrane protein [2].
Experimental
Phospholipid vesicles were prepared by co-solubilization and were composed of a 1:1 ratio of 1,2-Dipalmitoyl-sn glycero-3-phosphocholine (DPPC) and 1,2-dipalmitoyl-sn-glycero-3-phosphoethanolamine (DPPE) as well as a Na,K-ATPase enzyme that maintained a phospholipid to protein ratio of 1:3 (w/w). The sample was dispersed onto a mica substrate and placed into a metal sample holder.
Experiments were conducted with an NX10 AFM under ambient conditions using an active anti-vibration stage and acoustic enclosure using a force modulation mode (FMR) cantilever (2 N/m). Topography, adhesion energy and modulus images were acquired using PinPointTM nanomechanical mode.
Results and Discussion
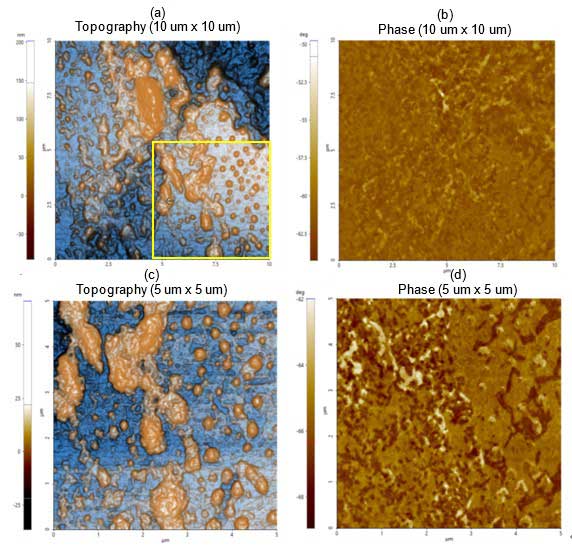
Figure 1a depicts the topography and phase images revealing particle of varying sizes. The smaller individual particles correspond to lipid vesicles and larger particles correspond to giant lipid vesicles and/or agglomerates. The yellow square highlights the scan area of subsequent images shown in figure 1c. The phase image shown in figure 1b reveals that the sample was homogeneously distributed over the substrate.
The dimensions of those particles identified in 1c are in the range of hundreds of nm in length (refer to figure 2 for the detailed analysis). The phase image (Figure 1d) allows distinction of particles and agglomerates from the substrate sample, mica in this case.

Figure 1. Non-contact (a) topography and (b) phase AFM images. Scan size: 10 µm × 10 µm, Image size: 256 pixels × 256 pixels. Magnified view of (c) topography and (d) phase inside the yellow box in figure 1a. Scan size: 5 µm × 5 µm, image size: 256 pixels × 256 pixels.
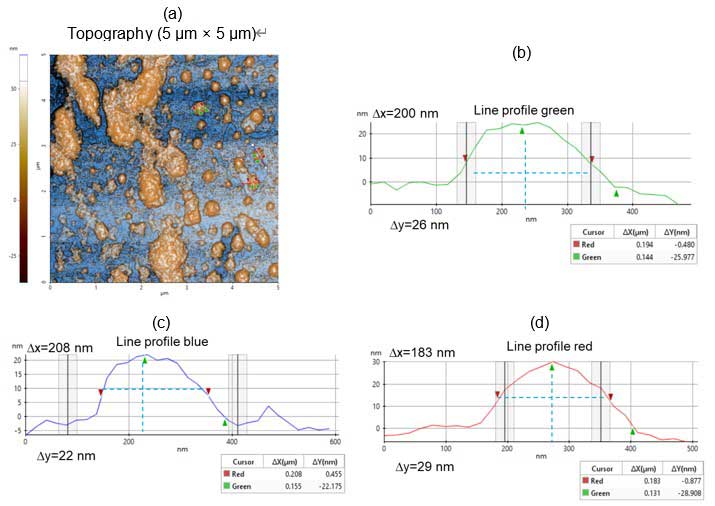
The three selected vesicles in figure 2a were measured. Figures 2b, 2c and 2d show the line profiles for vesicles marked by the green, blue and red lines, respectively. Their dimensions are 200 µm long by 26 µm high (blue), 208 µm long by 22 µm high (green) and 183 µm long by 29 µm high (red).

Figure 2. Topography images and line profile analyses: (a) Non-contact topography AFM image – scan size: 5 µm × 5 µm, image size: 256 pixels × 256 pixels; (b-d) Corresponding line profiles from figure 2a.
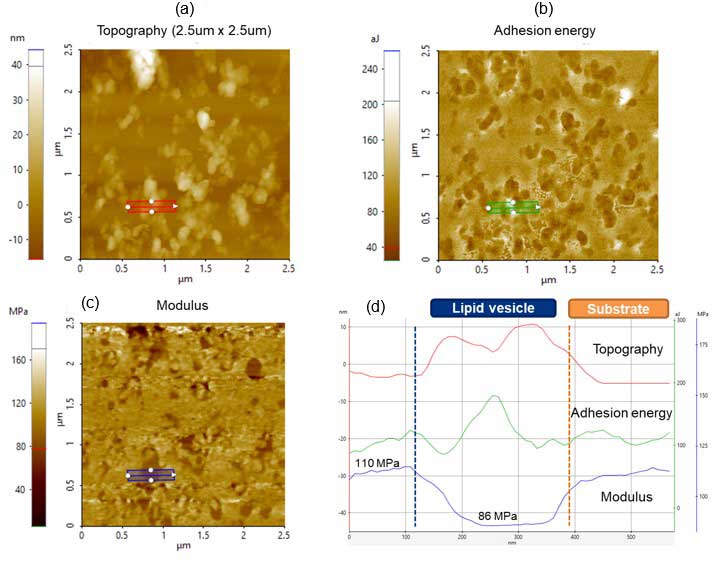
Topography, adhesion energy and modulus were simultaneously acquired during a single scan in PinPoint. Figure 3 shows the (a) topography, (b) adhesion energy and (c) modulus images taken. Line profiles along topography (red), adhesion energy (green) and modulus (blue) are shown as well. Figure 3d summarizes the quantitative results of the line profiles (Figures 3a-c). From 110 nm to 400 nm, measurements correspond to the selected lipid vesicle from the blue rectangle. From 400 nm to 600 nm, it corresponds to the substrate.
From the adhesion energy image (green line), higher values are observed for lipid vesicles compared with the substrate. The modulus on the lipid vesicle) is, as expected, smaller than that of the substrate.

Figure 3. PinPoint images: (a) Topography, (b) Adhesion energy and (c) Modulus images taken with an FMR cantilever; (d) Corresponding adhesion energy and modulus line profiles are shown in the bottom right panel.
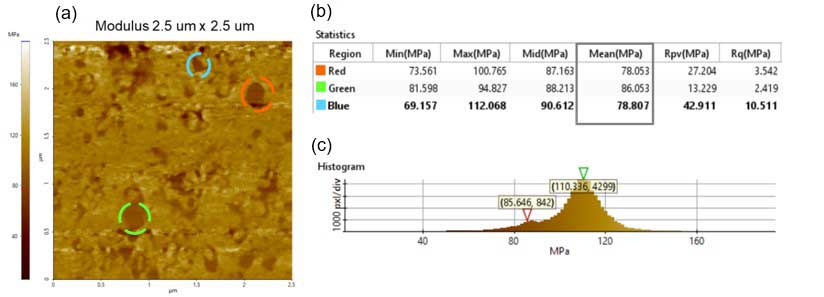
A higher resolution modulus dataset is shown in figure 4. Three areas within that image were selected to measure the modulus of individual particles. Those lipid vesicles were selected because of their defined shape. The module values for the selected vesicles are 78.05 MPa, 86.05 MPa and 78.80 MPa for the red, green and blue dotted circles, respectively.
There are two peaks that were detected in the modulus image histogram. One is ~86 MPa and the other is ~110 MPa. One of these values corresponds to lipid vesicles and the other to a relatively harder substrate. The modulus value differs from reported literature values (approximately 30 MPa) [4], and it is likely due to prolonged exposure to air that caused the hardening.

Figure 4. Modulus analysis obtained using the PinPoint mode: (a) Modulus image – scan size 2.5 µm × 2.5 µm, image size: 256 pixels × 256 pixels; (b) Statistics obtained with Park XEI software of the red, green and blue dotted circles statistics in figure 4a; (c) Modulus image histogram showing the two peaks detected.
Conclusions
Visualizing, measuring, and understanding the mechanical properties of biological and organic samples such as lipid vesicles on the nanoscale is important for understanding their function and uses. This study demonstrates that AFM can provide that information to the researcher with high precision and resolution. Specifically, this paper shows that an AFM can reliably generate nanoscale topography of lipid and acquire the modulus of the sample with high precision using Park’s PinPoint nanomechanical mode.
References
[1] Suzuki S., and Gerner P. (2013), Pharmacology and Physiology for Anesthesia, Elsevier, Inc.
[2] Picas L., Rico F., Scheuring S., Direct Measurement of the Mechanical Properties of Lipid Phases in Supported Bilayers. Biophysical Journal. Volume 102(1), 2012.
[3] AFM Imaging as a Tool to Visualize Bilayer Formation from Lipid Vesicles. Retrieved from https://www.parksystems.com/images/applications/biological/note/AN-R05.pdf
[4] Sebinelli H. G., Borin I. A., Ciancaglini P., and Bolean M., Topographical and mechanical properties of liposome surfaces harboring Na,K ATPase by means of atomic force microscopy. Soft Matter 15, 2737, 2019.
