Characterization of Extruded Collagen Fibres – Imaging Ellipsometry of Biomaterials
Christian Hoffmann, Peter H. Thiesen, Karsten Stapelfeldt, Naiana Suter and Dorothea Brüggemann
Introduction
Manufacturing bio-compatible surfaces has evolved into a cornerstone for downstream biomedical and pharmaceutical applications. In live tissues the structural and biochemical support for cells is maintained by various secreted extracellular matrix (ECM) components. The ex vivo deposition and network formation of these components on various scaffolds is crucial for subsequent cellular processes, thus vital for the production of tissue-like implants or effective cell-seeding on prostheses.
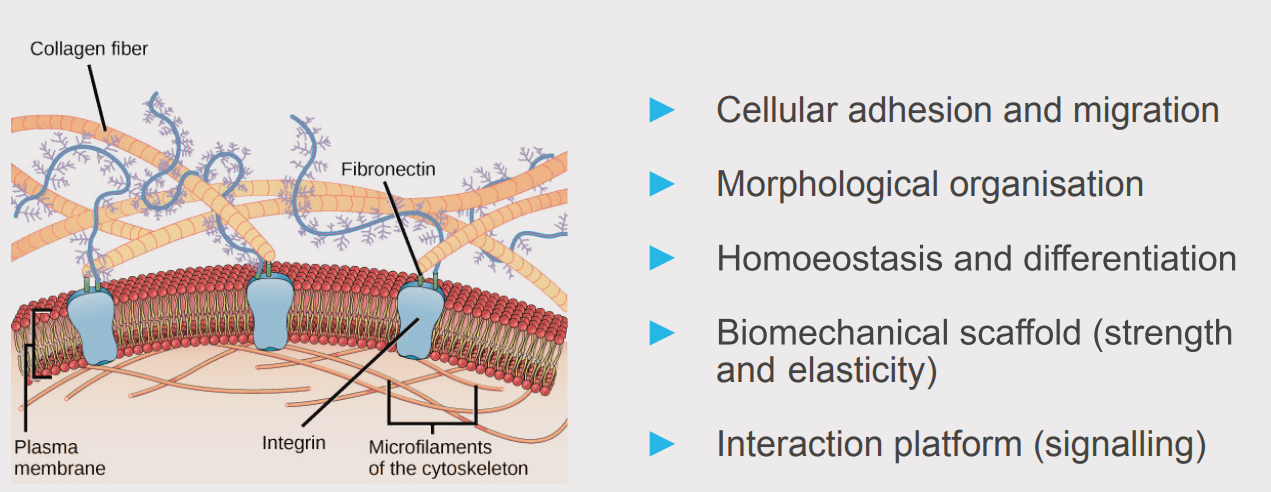
The extracellular Matrix (ECM)” by OpenStax is licensed under a Creative Commons Attribution 4.0 International License (CC BY 4.0)
Components of the ECM form a dense and dynamic network with essential functions for surrounding cells and tissues. Besides its role as a physical scaffold, it provides a biochemical and biomechanical base for cell homeostasis and differentiation.
Sample Description
Here we focus on collagen, a highly abundant protein and key component of the ECM. The purified protein was extruded through a nanoporous filter, like dough in a pasta machine, and deposited as a drop onto a conventional glass microscope slide [1]. This allows a scalable and tunable production of nanofibres under physiological conditions.
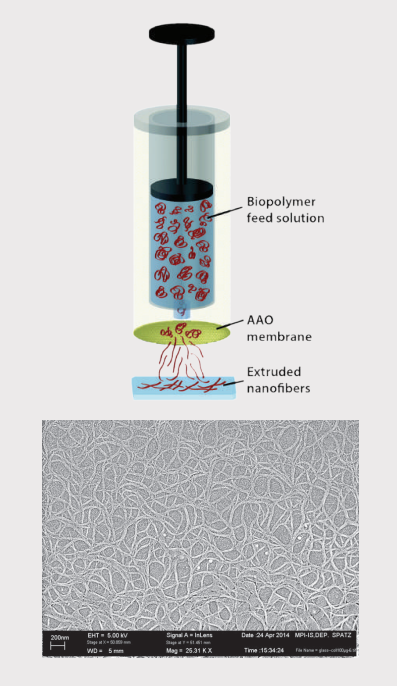
Sample preparation setup and SEM image of extruded collagen: The biopolymer solution is extruded through a nanoporous anodic aluminum oxide (AAO) membrane and collected on a glass slide [1].
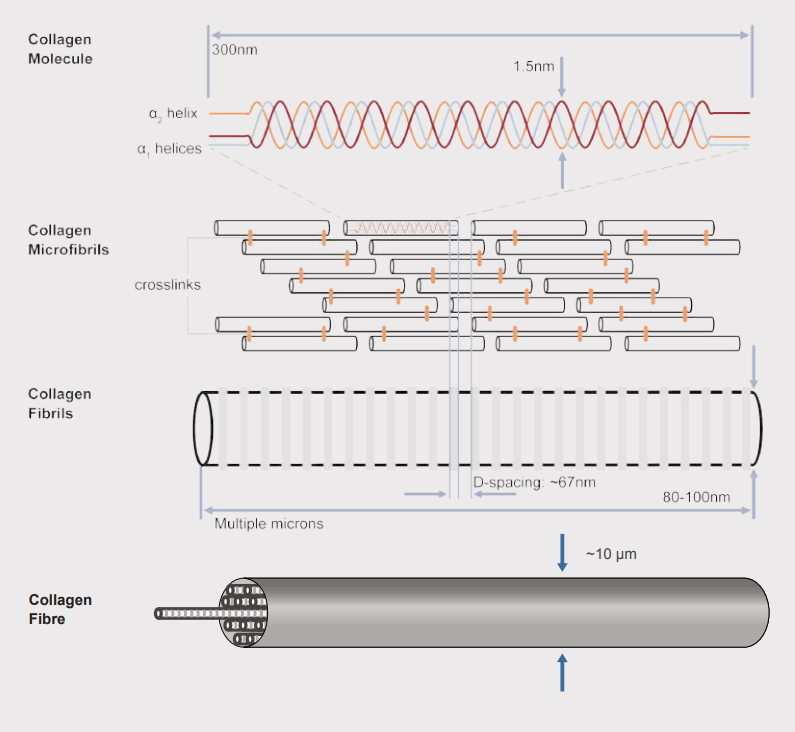
Collagen fibre hierarchical organization. Fibrils assemble into mature collagen micrometers in diameter [2].
Imaging Ellipsometry
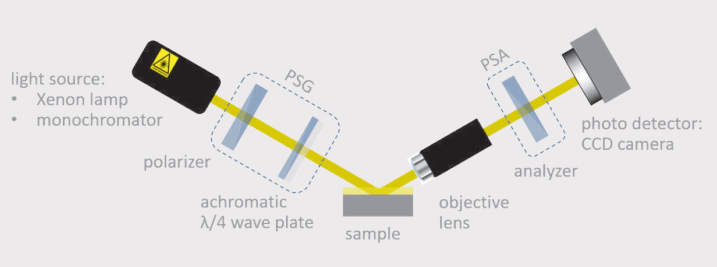
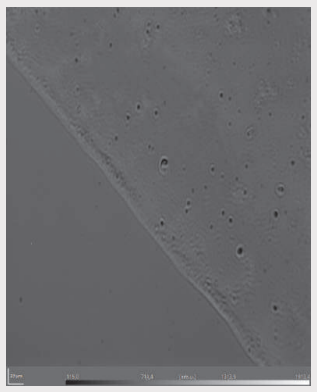
Schematic drawing of the ellipsometer and its main components (left). Live view from the CCD camera showing the transition between the glass substrate and the collagen extrusion area.
For the analysis of the extruded fibres we performed imaging ellipsometry-a combination of ellipsometry and microscopy.
- Spectroscopic imaging ellipsometer
- Objective: 10x magnification
- Automated x-y-sample stage for micrograph stitching
- Knife-edge illumination for transparent substrates
- Light source: grating monochromator λ = 360‒1000 nm
- Automated head alignment
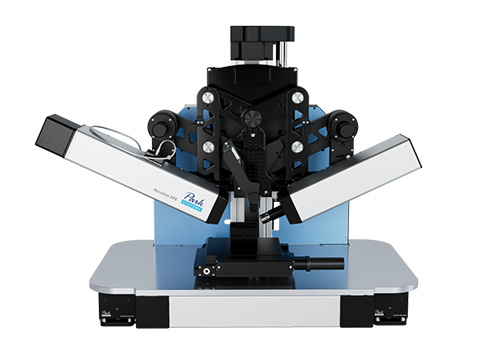
Imaging spectroscopic ellipsometer: nanofilm_ep4
Contrast Micrograph Stitching
Contrast micrographs allow a fast visualisation of the sample while the rotation of optical components or angle of incidence (AOI) changes enhance the contrast in live view. With the help of the automatic x-ysample stage a total sample overview covering 2.7 cm2 was generated by the integrated image stitching algorithm combining 1008 single contrast micrographs into one image. This fast and automated approach assists sample orientation and can be further optimised for sophisticated measurement tasks (Δ/Ψ, refractive index, mapping).
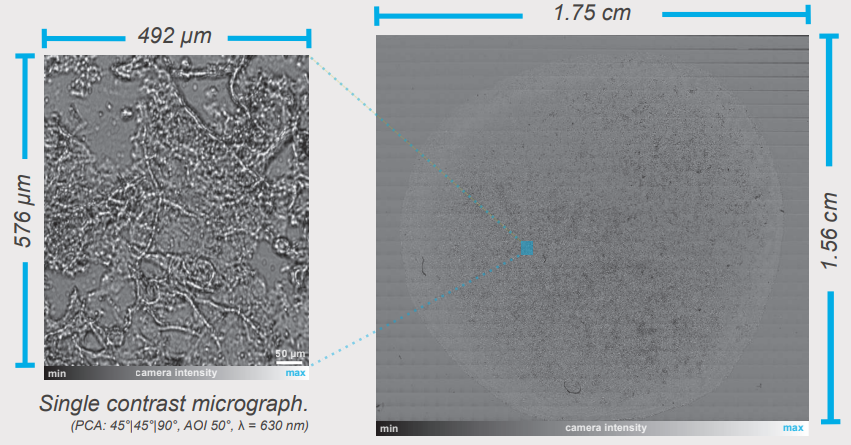
Sample overview stitching of 1008 single CMs) (PCA: 45°|45°|90°, AOI 50°, λ = 630 nm)
Knife-edge Illumination
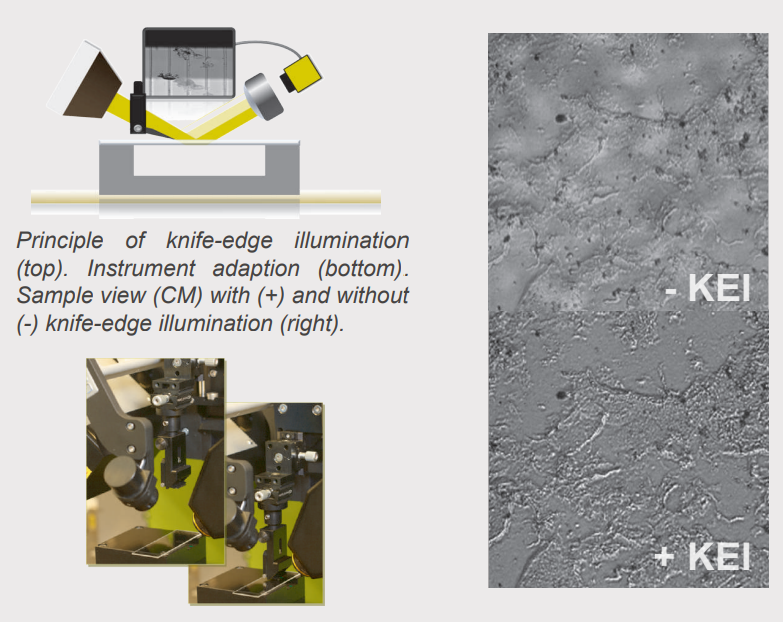
Principle of knife-edge illumination. Instrument adaption. Sample view (CM) with (+) and without (-) knife-edge illumination.
Imaging ellipsometry on transparent substrates is often challenging due to disturbing reflections of the incident light at the back of the substrate. Therefore the unique knife-edge illumination feature is applied to suppress the disturbing reflections in a non-invasive manner. A region free of back-surface reflection is created by cutting the incident light beam.
Spectroscopic Ellipsometry
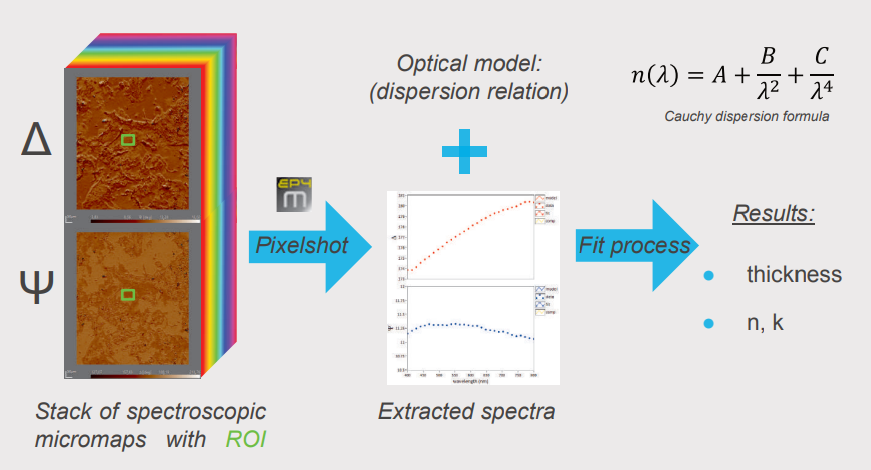
Spectroscopic ellipsometry was performed recording four-zone nulling micromaps of A and 4 at 27 selected wavelengths between 400 and 800 m. Every pixel of such an overall-focused micromap denotes a measured value for Δ and Ψ at the specific wavelength. Regions of interests (ROls) were selected on the micromap for further analysis and modelling. With the help of the pixelshot tool, A and 4 spectra were extracted from the stack of spectroscopic micromaps based on the selected ROls. These spectra were transferred to the Accurion EP4 model software for in-depth sample characterisation (optical parameters, thickness).
Modeling of Optical Parameters and Collagen Thickness
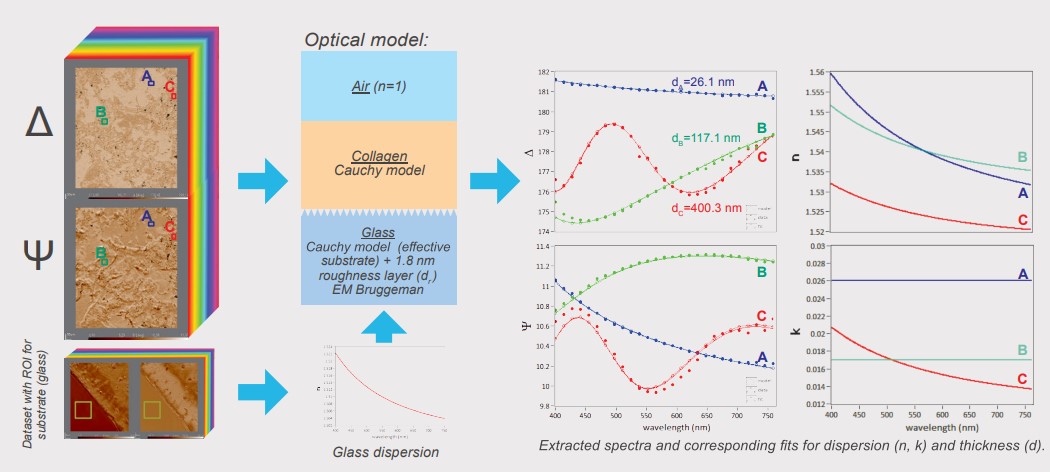
For the characterisation of the substrate the plain glass slide was measured using spectroscopic ellipsometry and described by a Cauchy model (fit for n, k=0). The data indicated a roughness layer which is parameterised by the Bruggeman effective medium approach with a fix 50% volume fraction glass/air. Fitting for the thickness resulted in a reasonable glass descripition which was kept fix as a common substrate for further analysis (dr = 1.8 nm). The collagen layer is described by a Cauchy model. Three distinct regions were selected in the dataset (A, B and C) and the resulting spectra were used to extract the optical properties and collagen thickness. The use of the extinction coefficient (k) was necessary to model the data indicating possible absorption effects of the collagen material. Fitting remains challenging indicated by observed correlation effects of the fitted parameters (n, k, thickness). Nevertheless, the refractive index for all modelled regions of interest shows a common trend in good agreement with our expectations and results in reasonable optical thicknesses for the extruded collagen.
Conclusions
- Contrast micrographs provide a fast sample inspection of the extruded collagen
- Stitching is convenient for sample orientation and reveals differences between sample regions
- Knife-edge illumination is essential for collagen characterisation on conventional glass slides
- Spectroscopic imaging ellipsometry on a challenging biological sample (non-homogeneous)
-Modelling and fit results (thickness, refractive index) in good agreement with expectations Future efforts: collagen deposition on gold; higher magnification; additional data (angle of incidence variation) for improved modelling; collagen concentration variations
