Imaging Spr in the Ellipsometric Mode for Biomolecular Interaction Studies I
Introduction
nanofilm_ep4
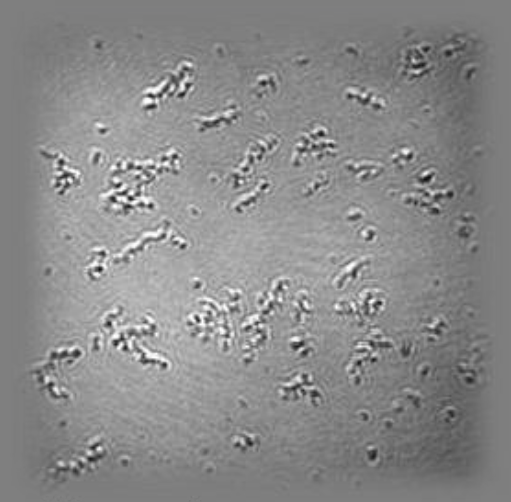
Ellipsometric contrast Oil | DMPE | water
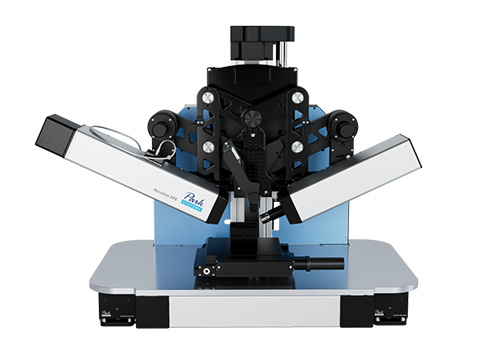
Frontview Nanofilm_ep4
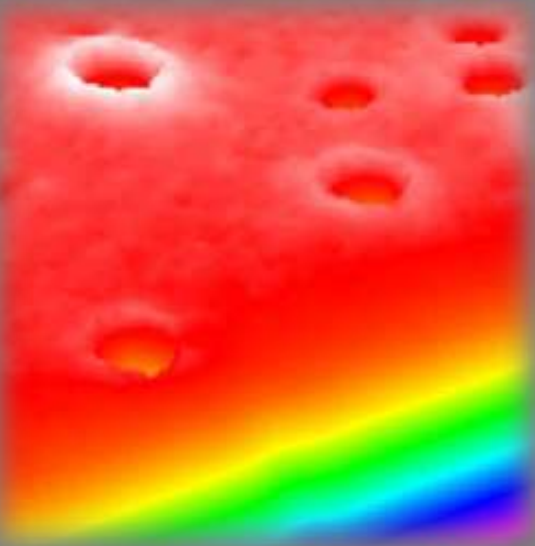
Thickness map Air | OTS | SiO₂ | Si
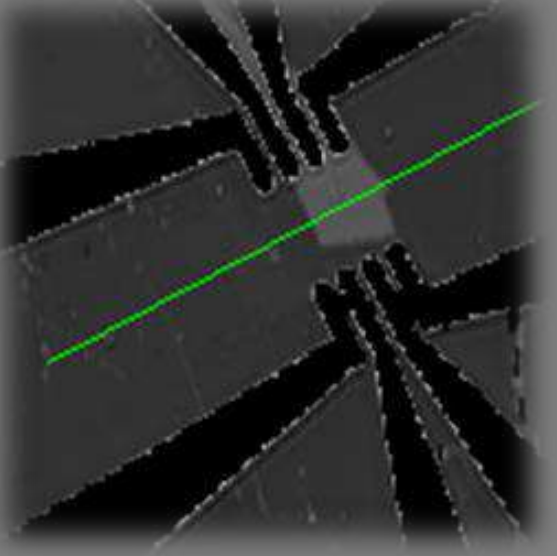
Delta map Air | Graphene | SiO₂ | Si
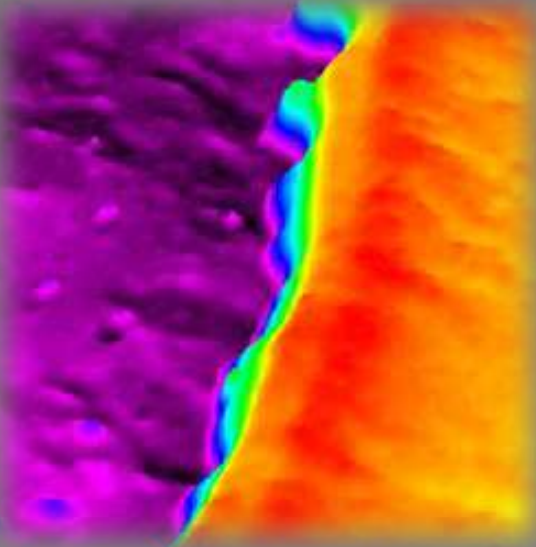
Thickness map Air|PEDOT|ITO|PET-foil
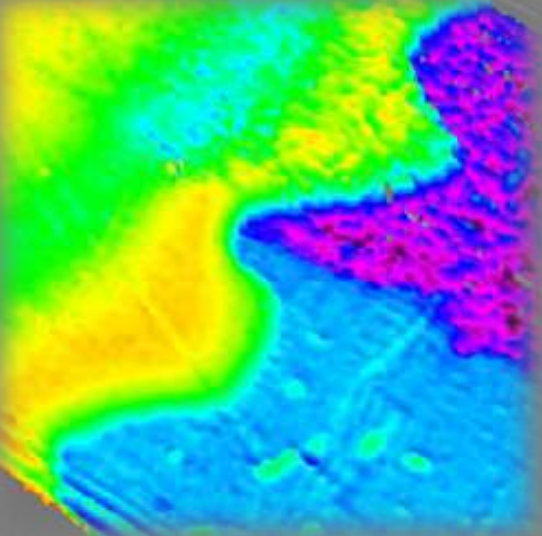
Psi-map Air|Photoactive layer|PET

Perspective Nanofilm_ep4
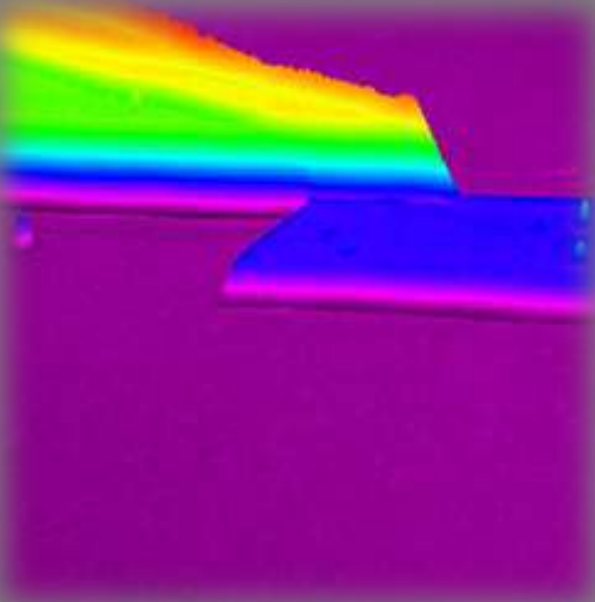
Delta map Air|Graphene|SiO2|Si
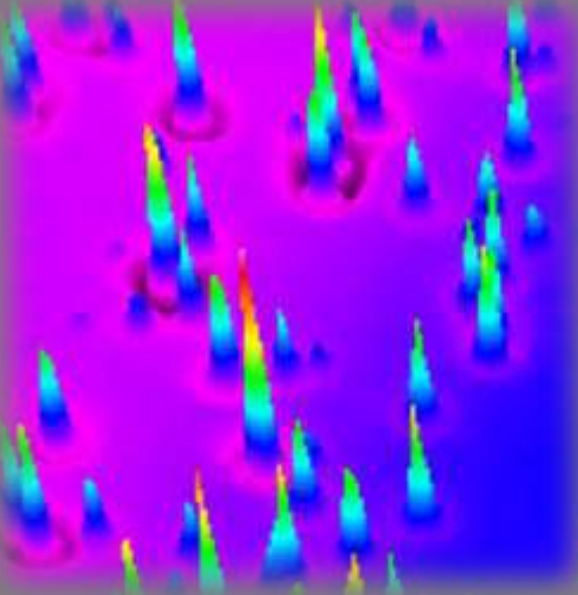
Thickness map Air|PCBM(spin-coated)|gold
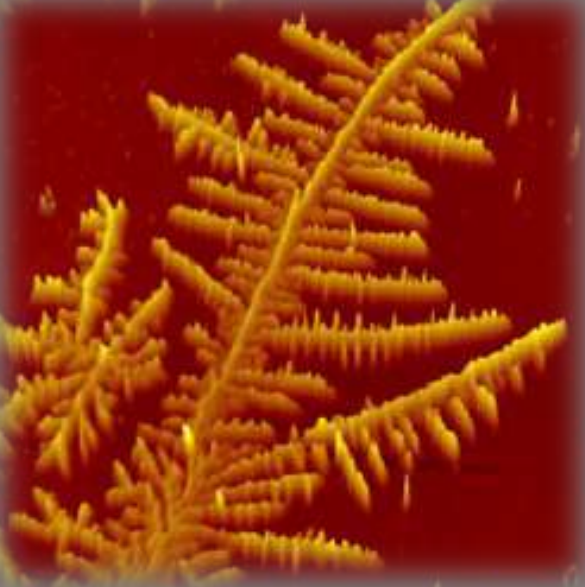
Thickness map Air|PEG-SH|gold
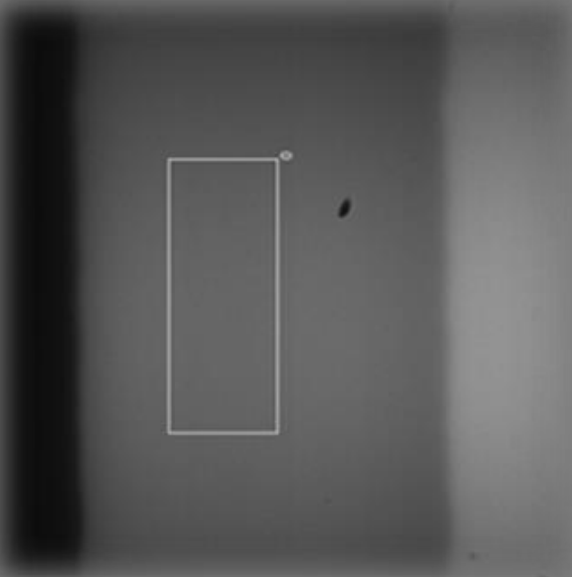
Knife edge illumination Air|glass
Measurement procedures :
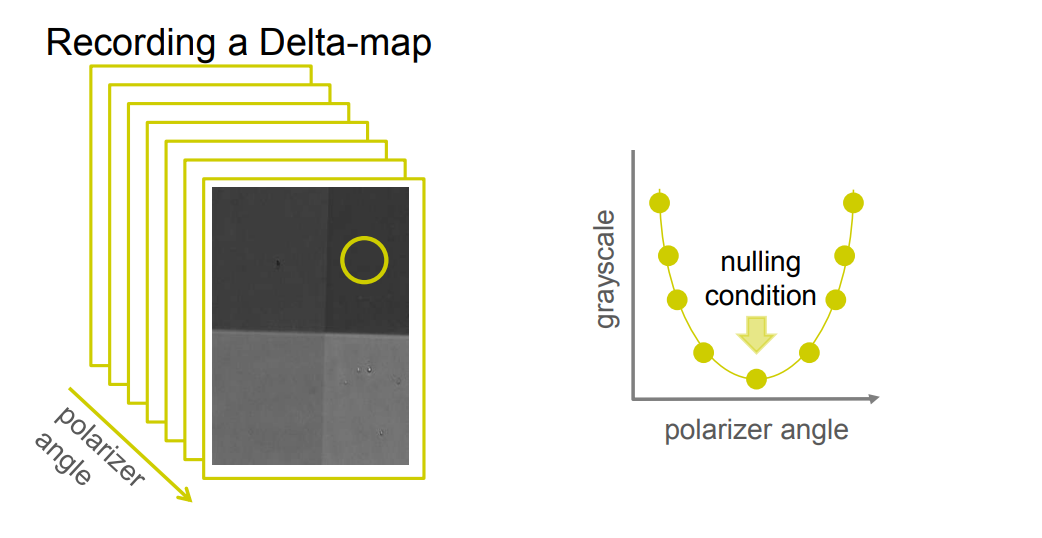
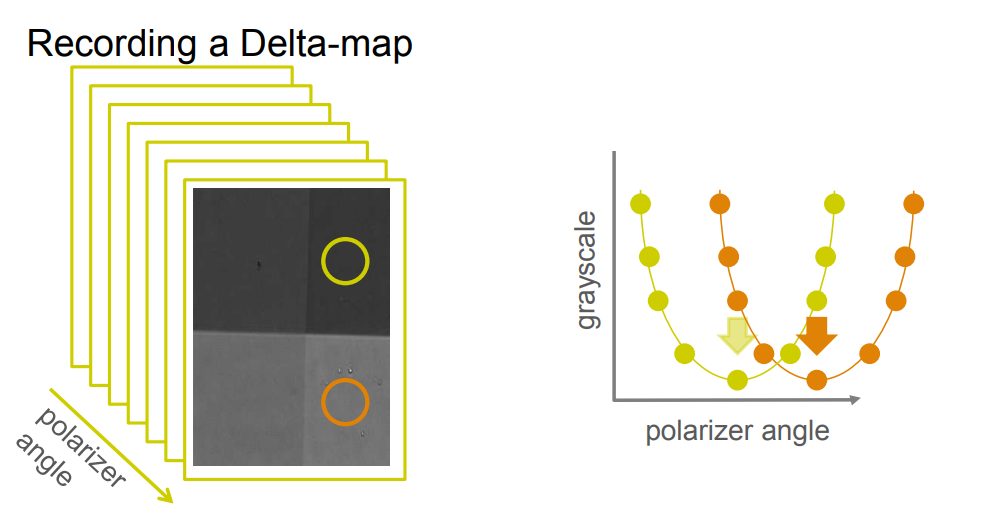
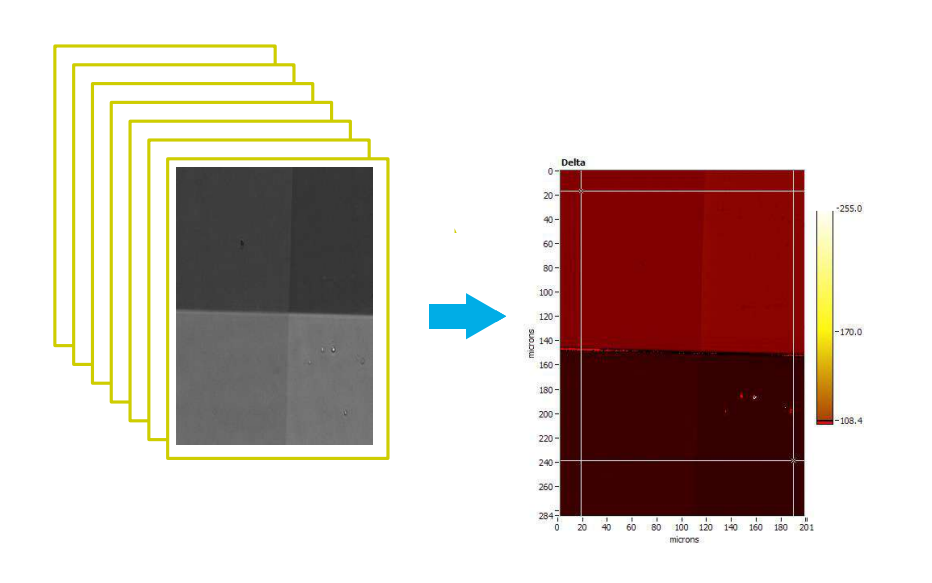
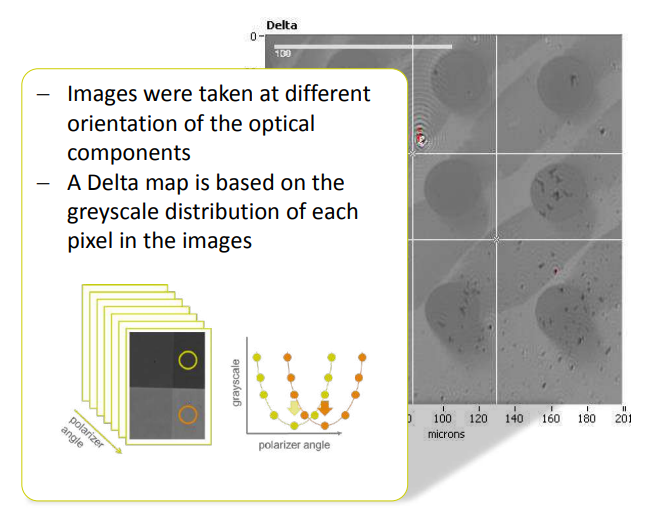
Imaging ellipsometry Delta and Psi maps
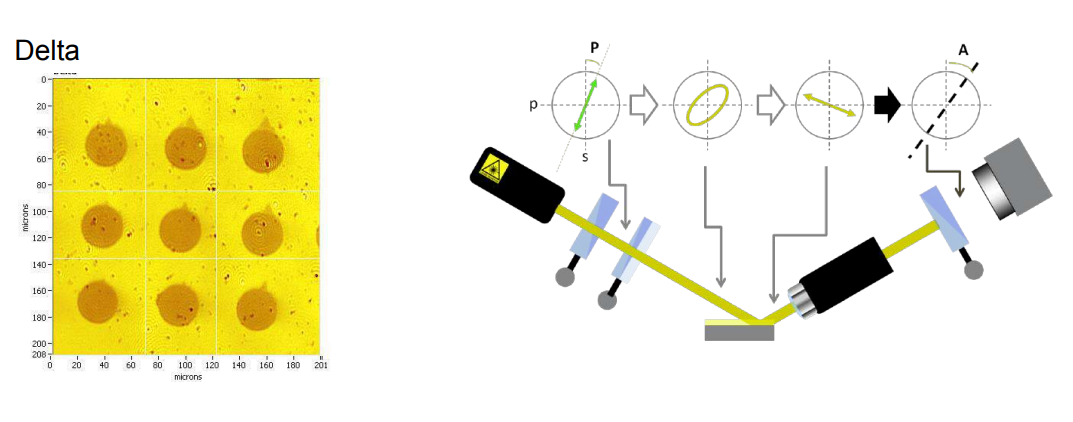
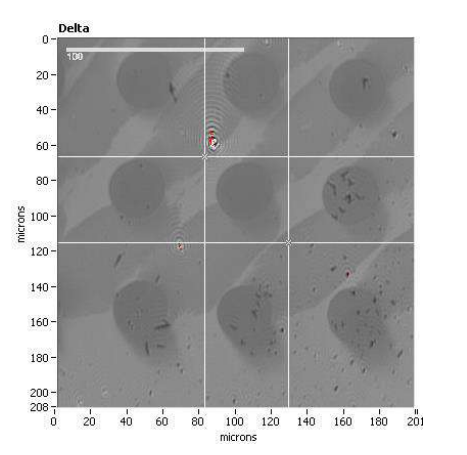
Recording a Delta-map
Imaging ellipsometry
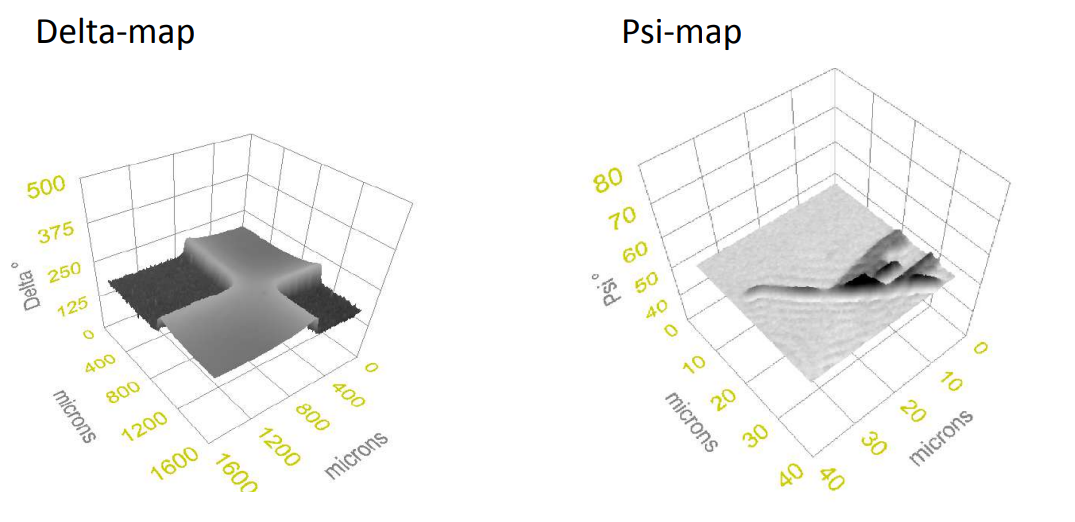
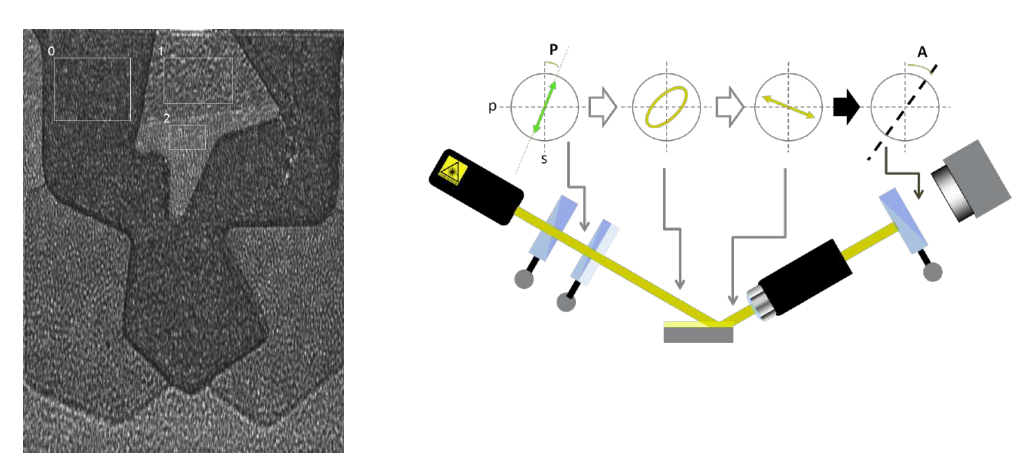
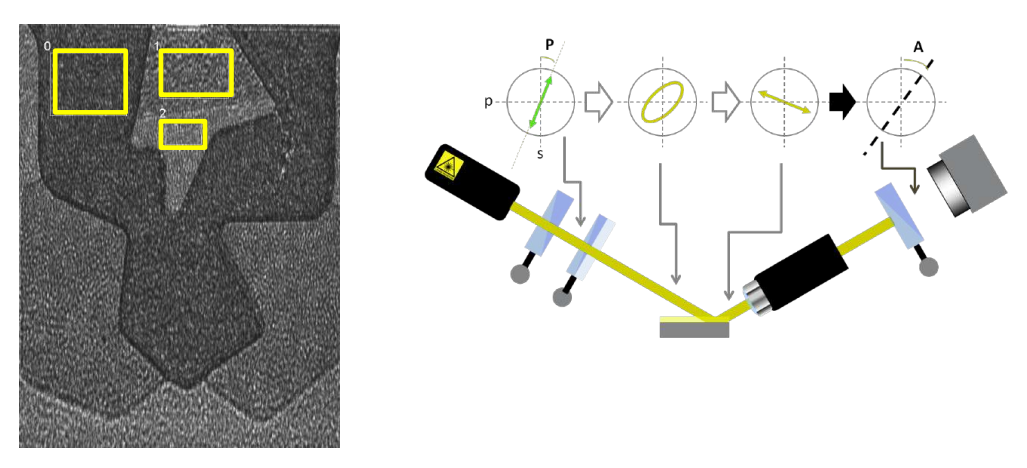
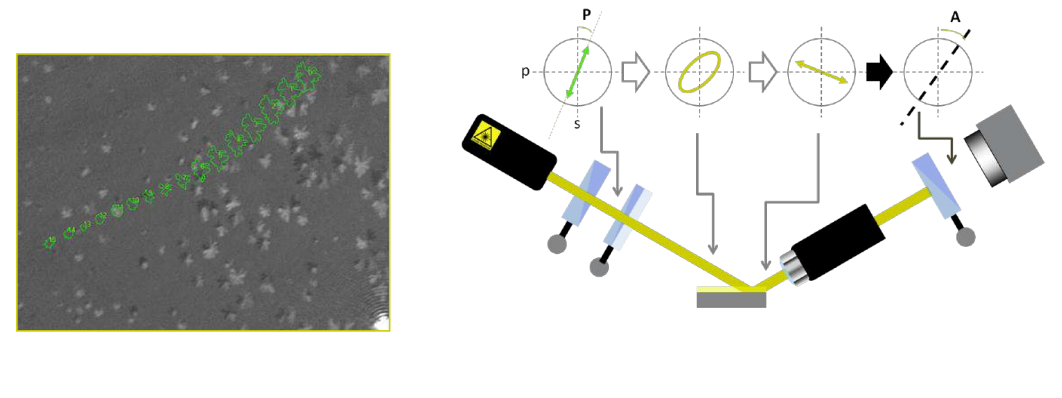
maps measurement procedures: patented Regions of Interest (ROIs) concept
Regions of interest
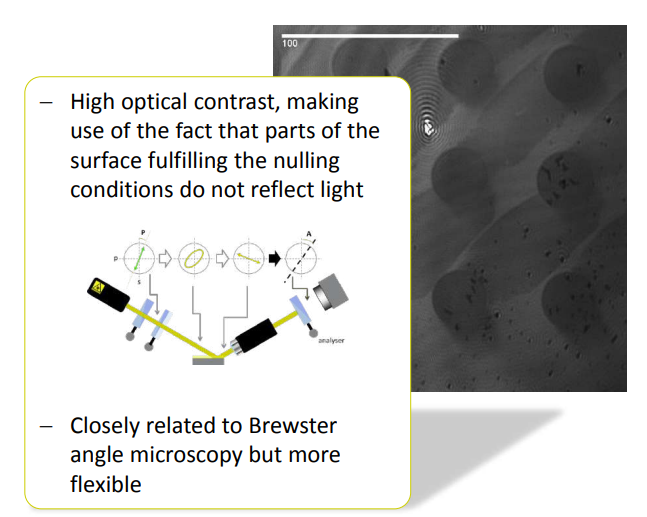
Why nulling ellipsometry?
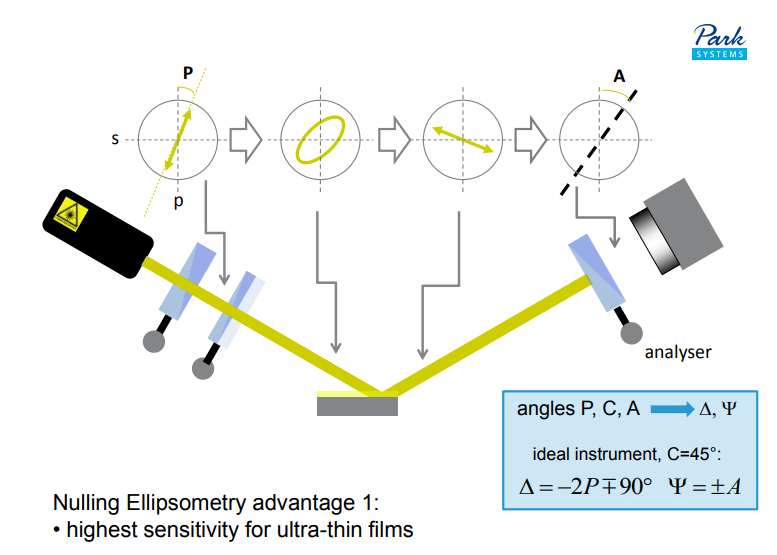
Nulling Ellipsometry advantage 1:
• highest sensitivity for ultra-thin films
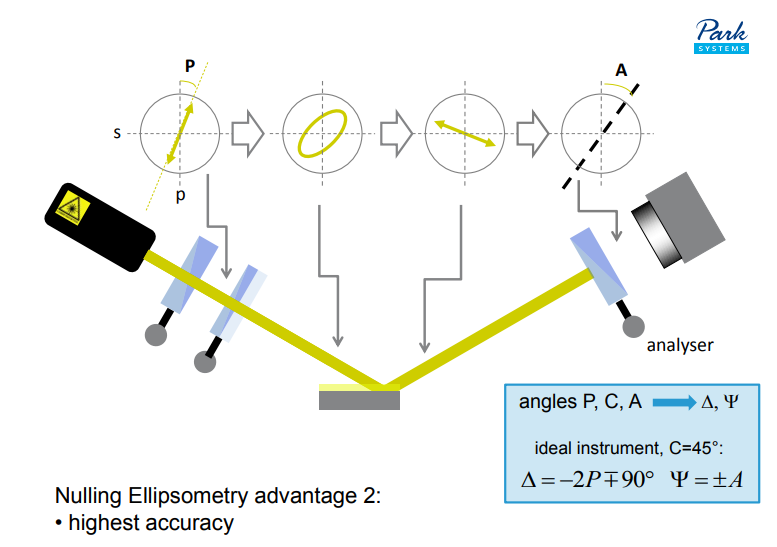
Nulling Ellipsometry advantage 2:
• highest accuracy
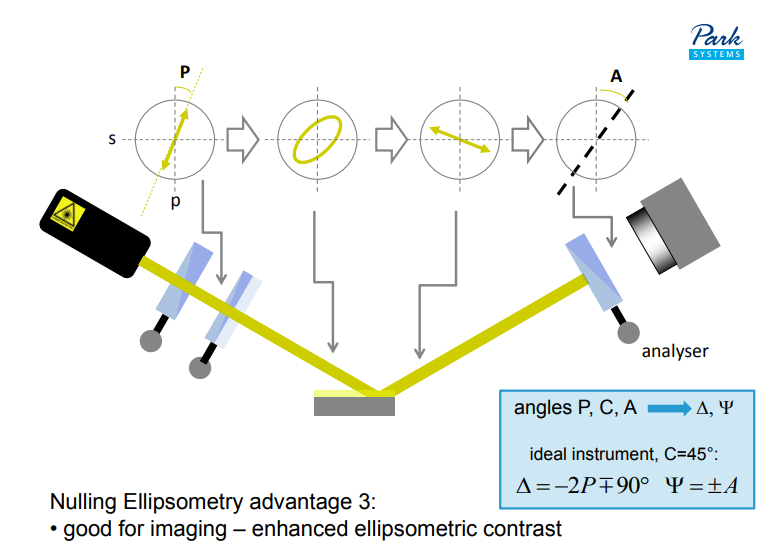
Nulling Ellipsometry advantage 3:
• good for imaging – enhanced ellipsometric contrast
applications of imaging ellipsometry
Typical application of Imaging ellipsometry
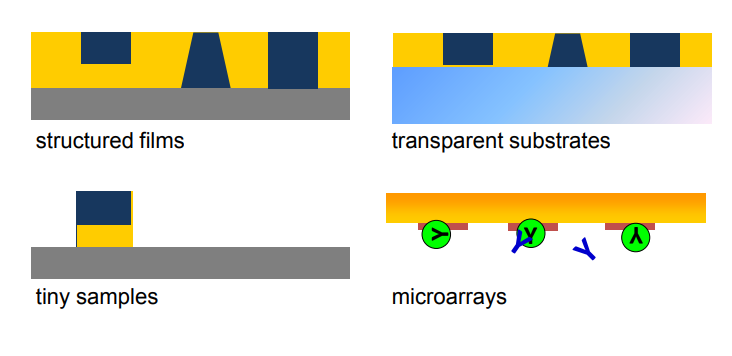
Typical application
antigen/antibody interaction at the surface of optislides
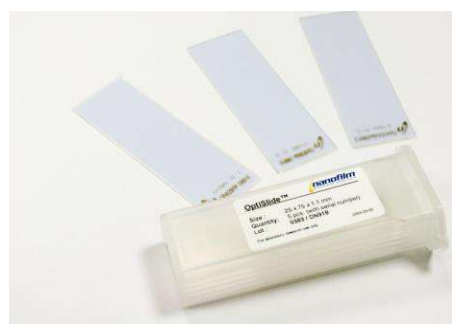
Optislides
The nanofilm_optislides are especially designed glass slides with optimal optical properties for measurements of bio-relevant layers - e.g. proteins, DNA, lipids, etc.
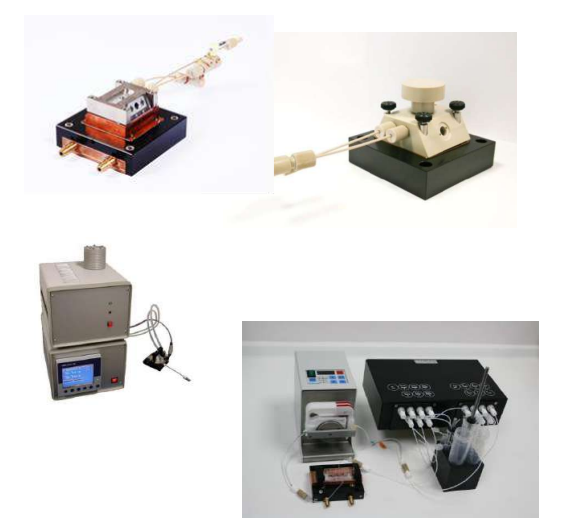
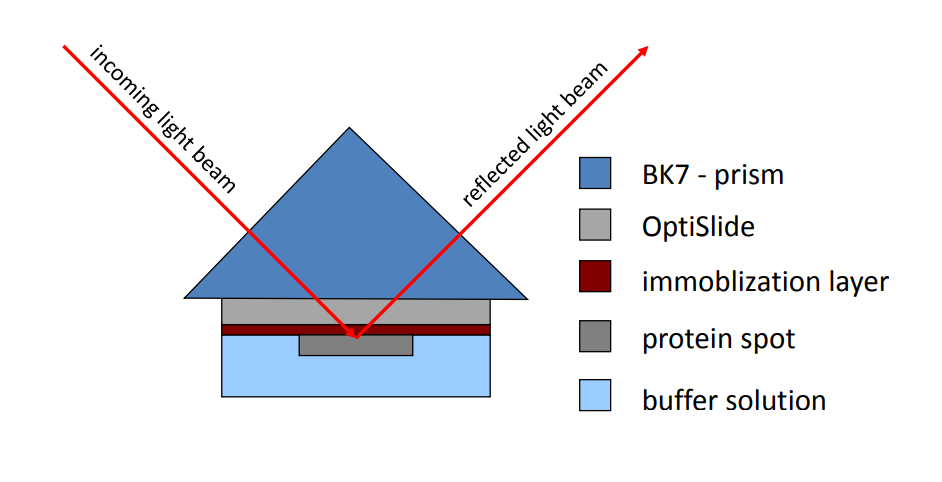
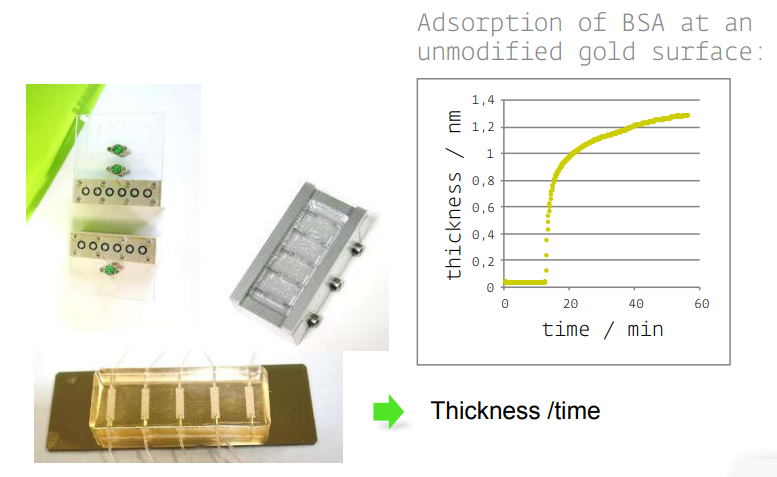
Kinetic/SPR-cell with optislides
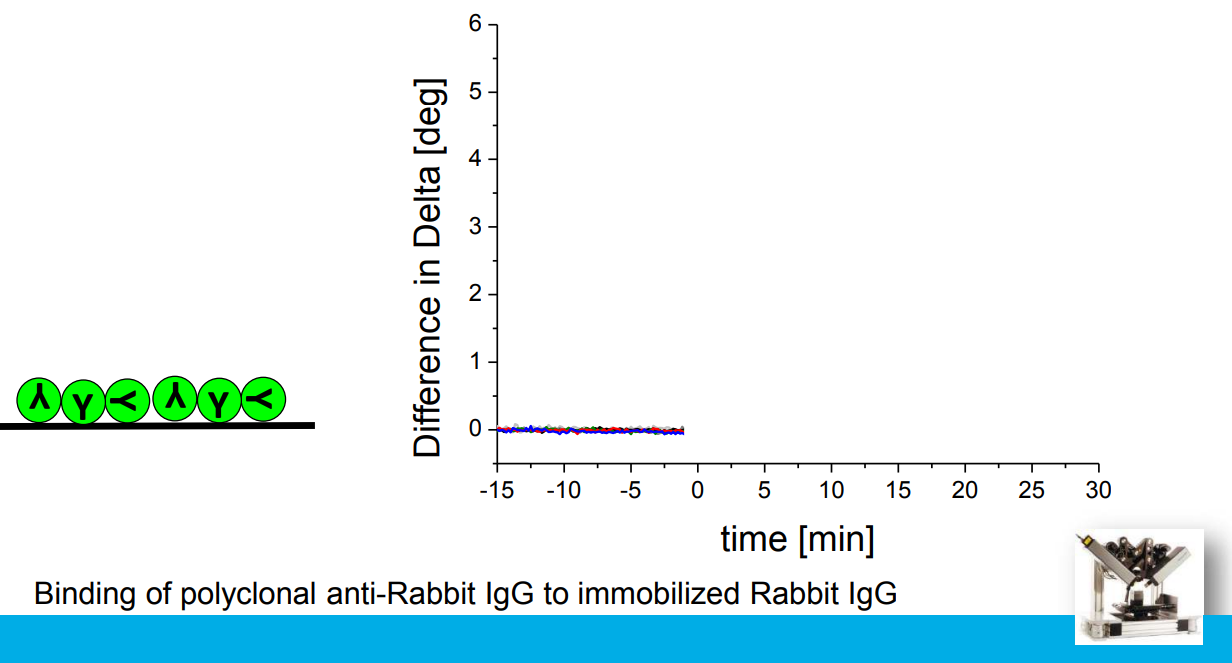
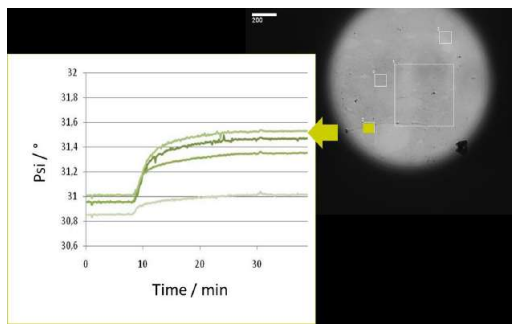
Association at various analyte concentrations
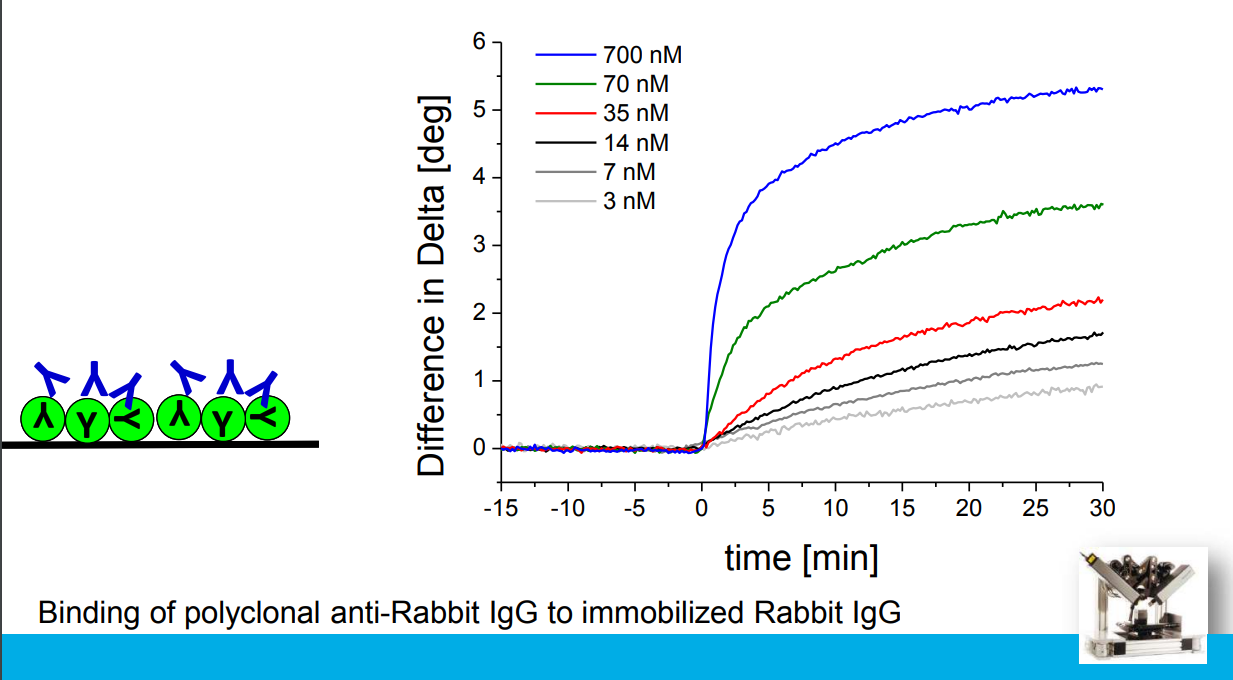
Association at various analyte concentrations
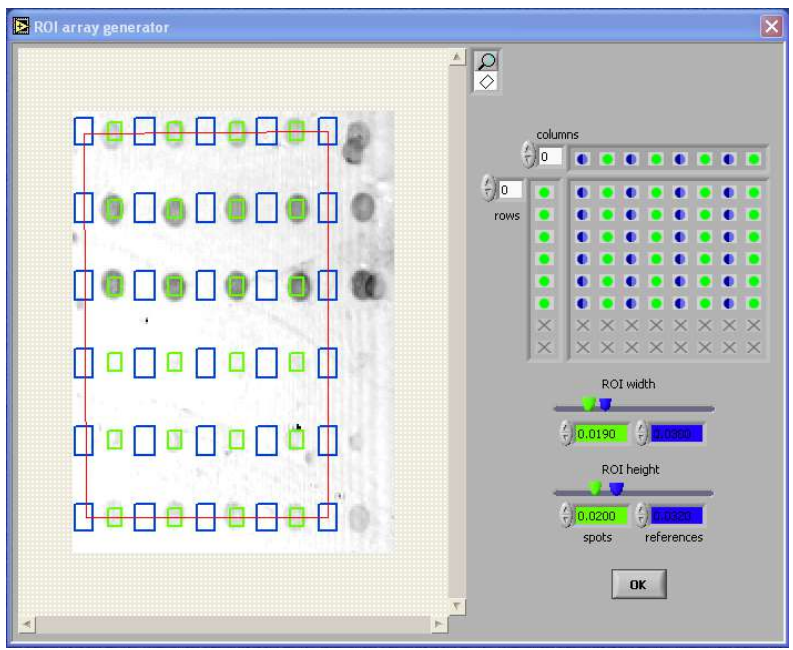
Array generato
- software wizards for easy ‘region of interest’ pattern
- generation on symmetric rectangular microarrays
- definition of spot and reference regions
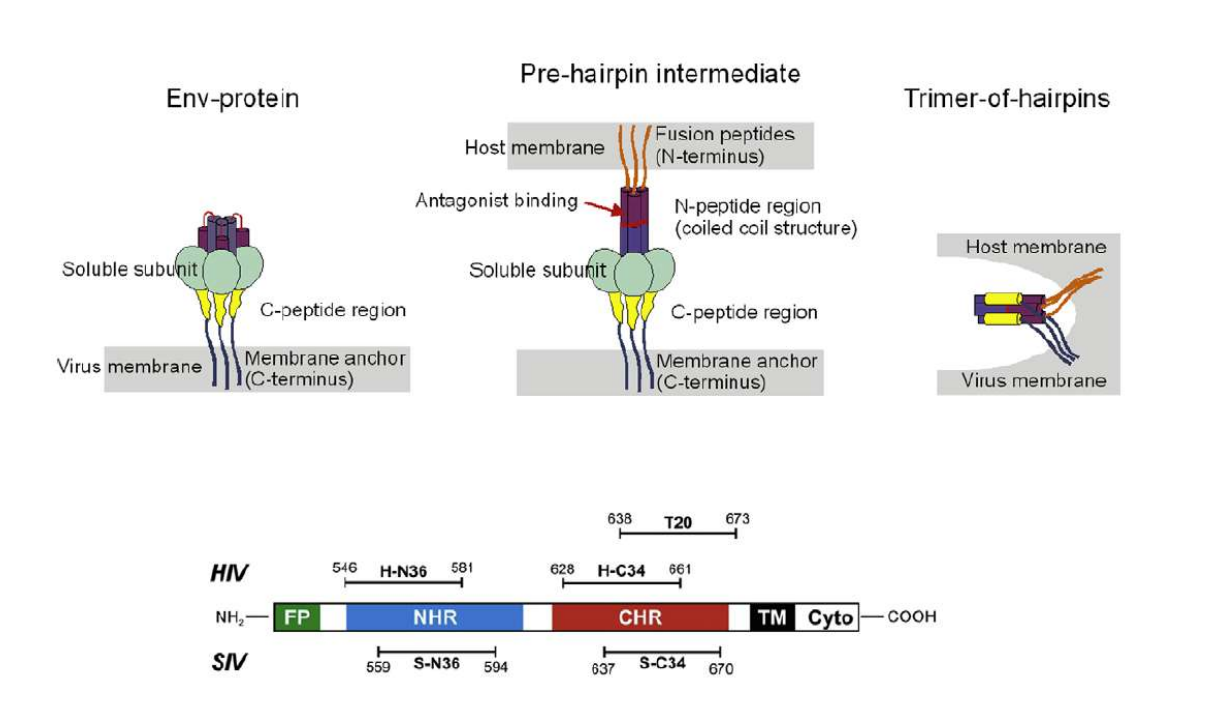
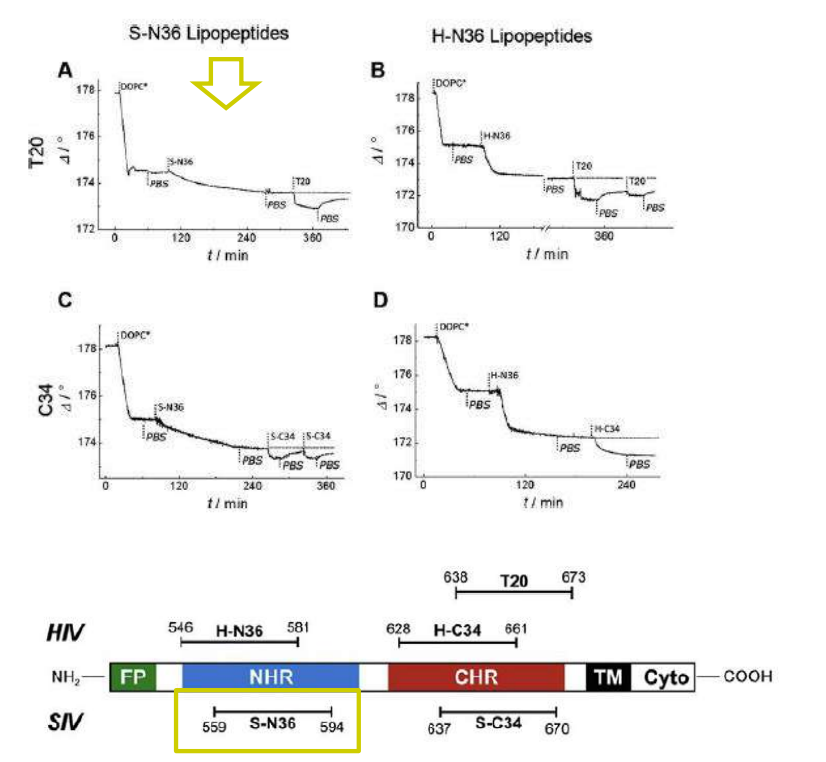
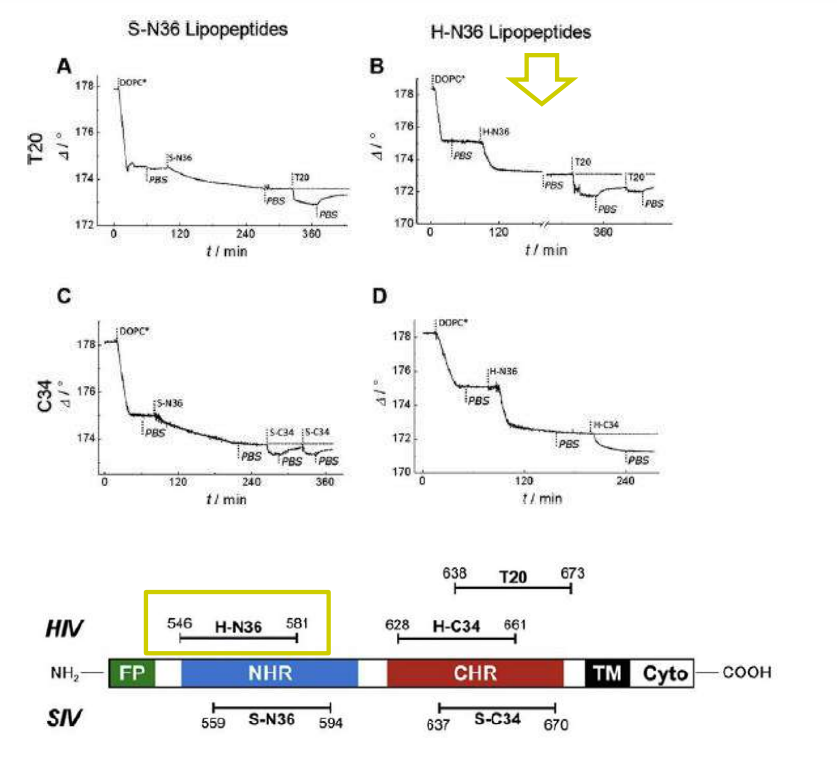
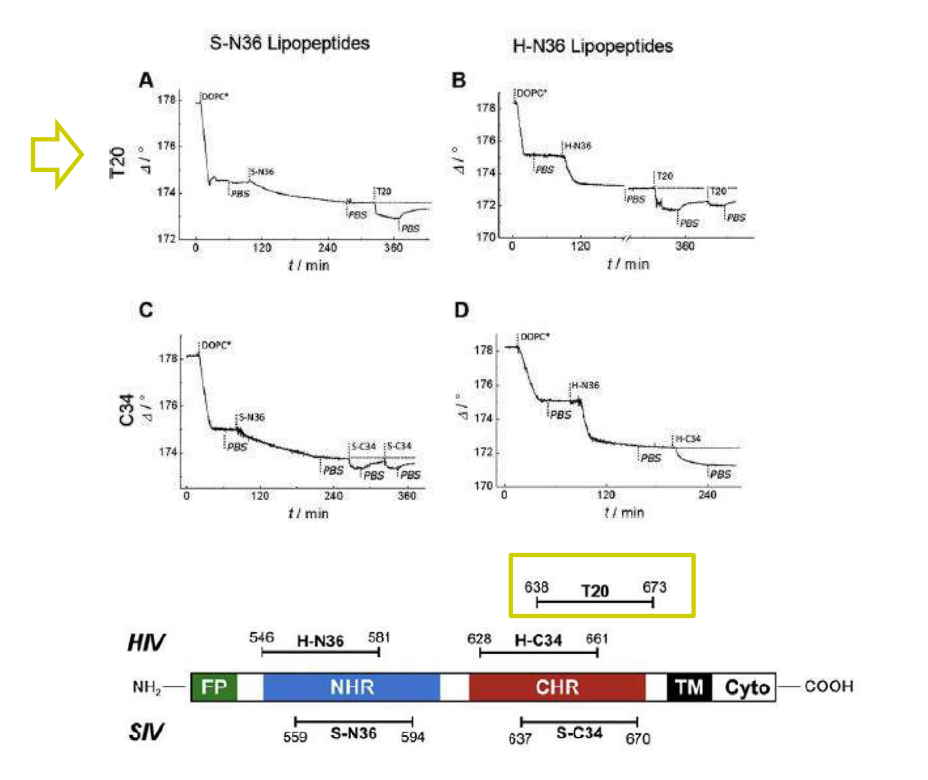
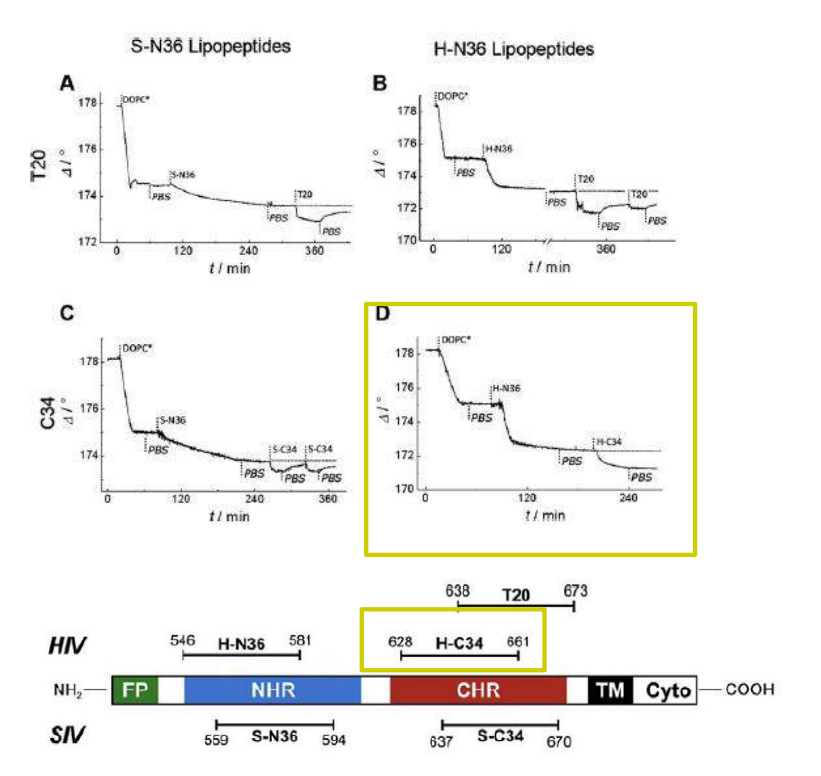
Lipopeptides derived from HIV and SIV mimicking the prehairpin intermediate of gp41 on solid supported lipid bilayers
<Schuy S, Schäfer E, Yoder NC, Kumar K, Vogel R, Janshoff A (2009) Lipopeptides derived from HIV and SIV mimicking the prehairpin intermediate of gp41 on solid supported lipid bilayers. Journal of Structural Biology 168, 125–136>
Time course of the D values obtained from ellipsometric measurements during the in situ coupling reaction of simian immunodeficiency Virus (S-N36) and human immunodeficiency virus (H-N369) to a lipid bilayer composed of 90% DOPC/10% MCC-DOPE (DOPC*) and subsequent adsorption of potential antagonists of the trimer-of-hairpin conformation C34 and as a function of time
simian immunodeficiency Virus (S-N36)
human immunodeficiency virus
Supported Lipid Bilayers at Skeletonized Surfaces for the Study of Transmembrane Proteins
<Fabre RM, Okeyo GO, Talham DR (2012,) Supported Lipid Bilayers at Skeletonized Surfaces for the Study of Transmembrane Proteins. Langmuir 28, 2835-2841>
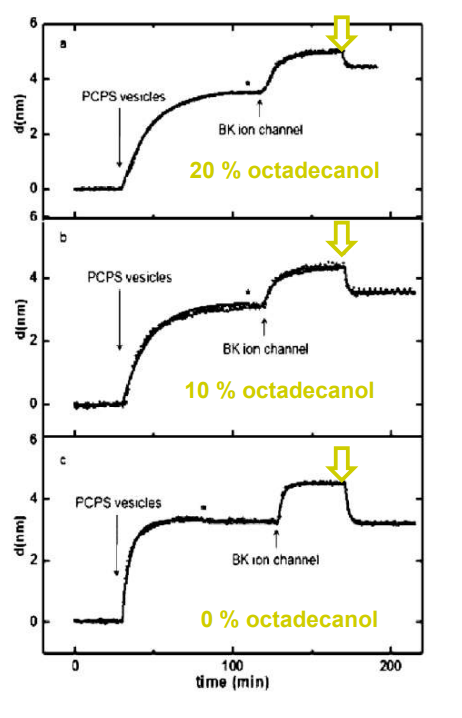
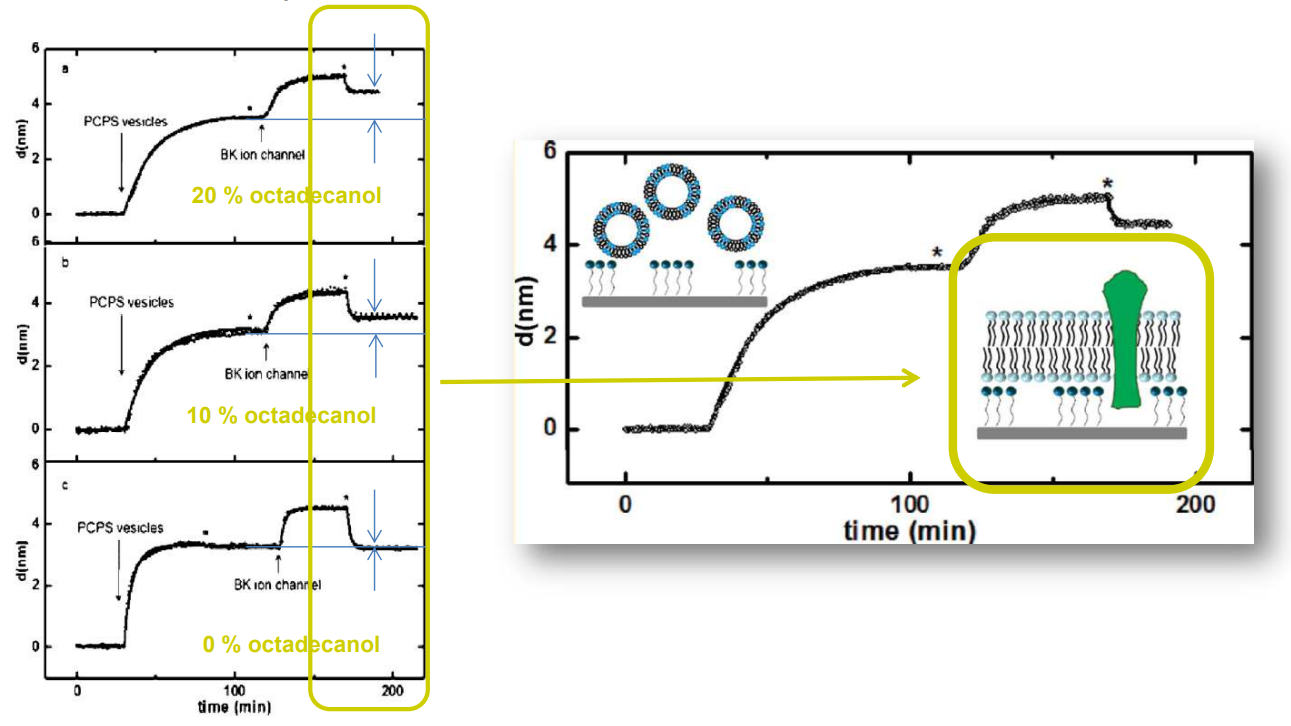
SPREE analysis of BK ion channel incorporation into lipid membranes
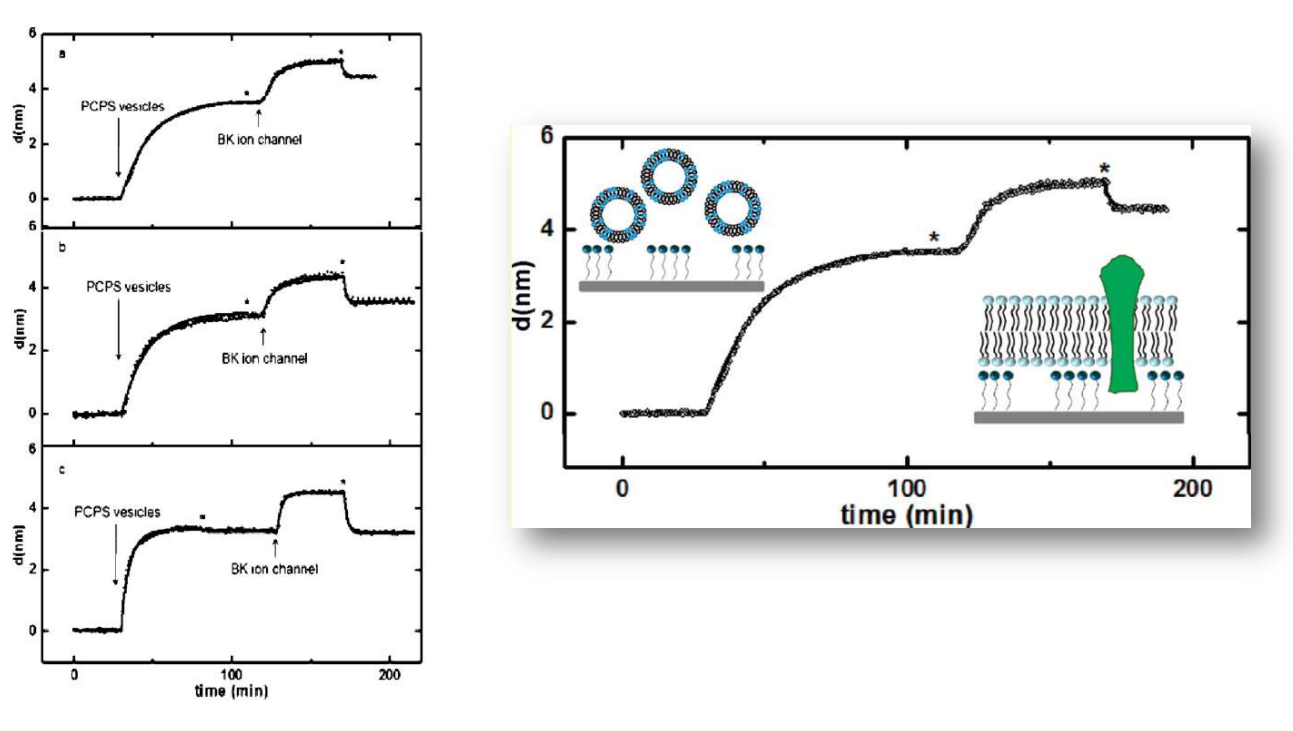
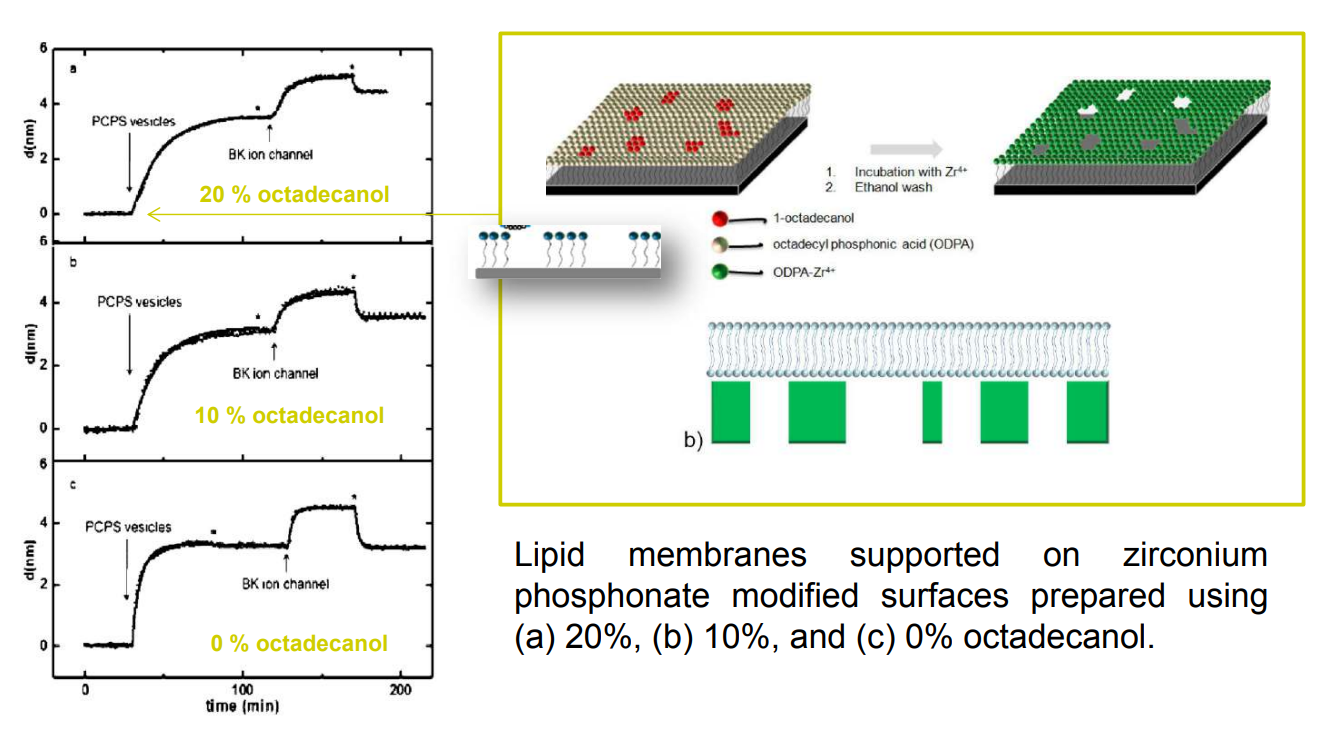
Free vesicles were then removed with buffer rinsing
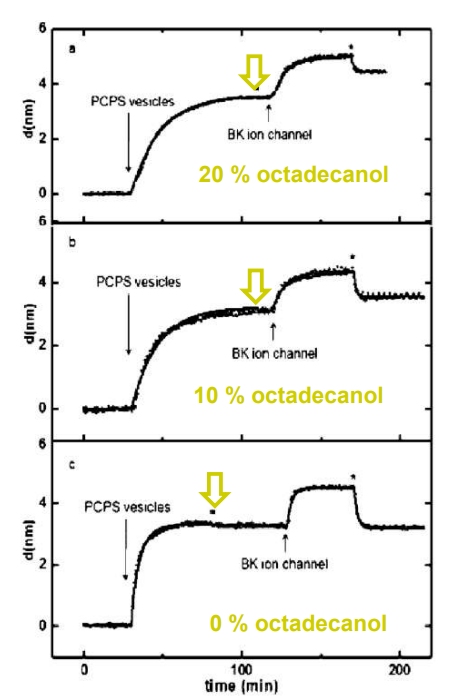
BK ion channel incorporation into lipid membranes supported on zirconium phosphonate modified surfaces
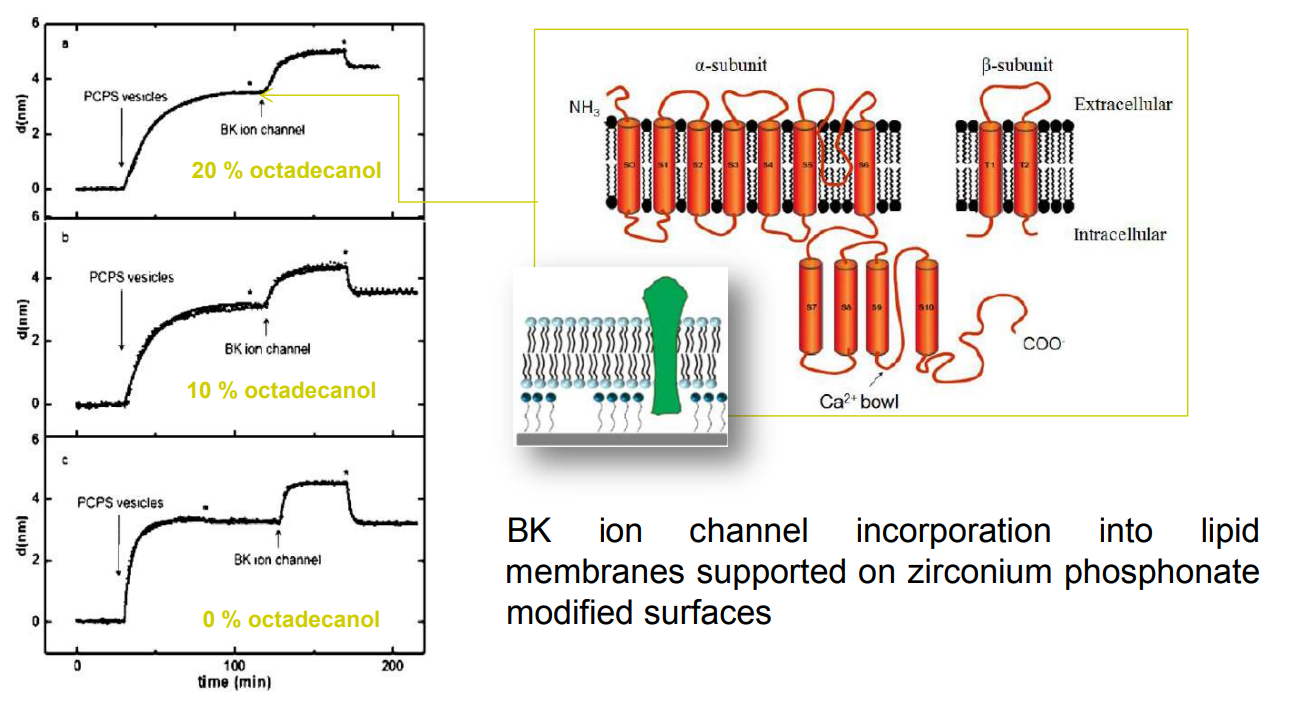
The membrane was again rinsed with buffer. The buffer used was trizmahydrochloride and sodium chloride at pH 7.4..
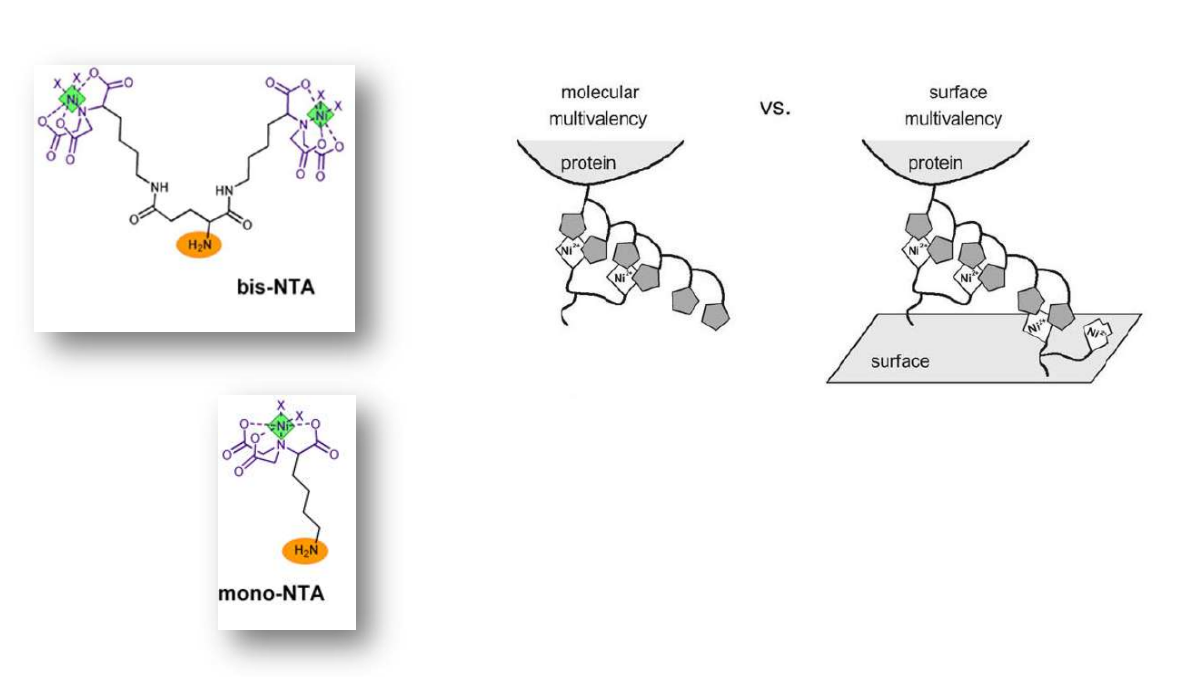
Differential Protein Assembly on Micropatterned Surfaces with Tailored Molecular and Surface Multivalency
<Valiokas R, Klenkar G, Tinazli A, Tamp R, Liedberg B, Piehler J (2006) Differential Protein Assembly on Micropatterned Surfaces with Tailored Molecular and Surface Multivalency. ChemBioChem 7, 1325 – 1329..>
Multivalent chelator head groups
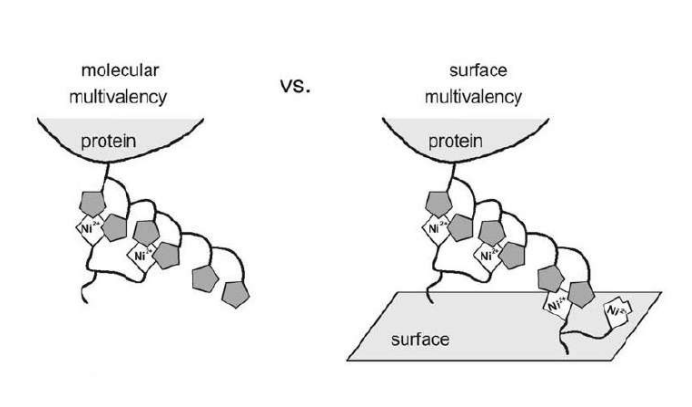
Multivalent chelator head groups
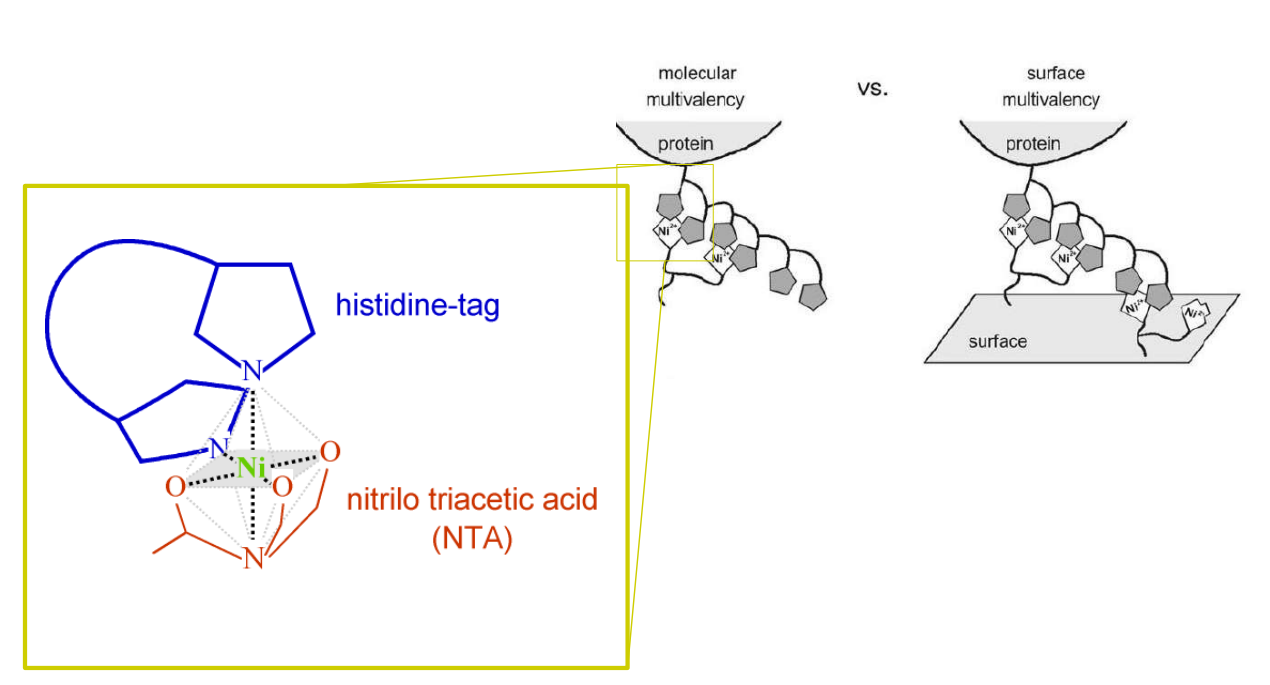
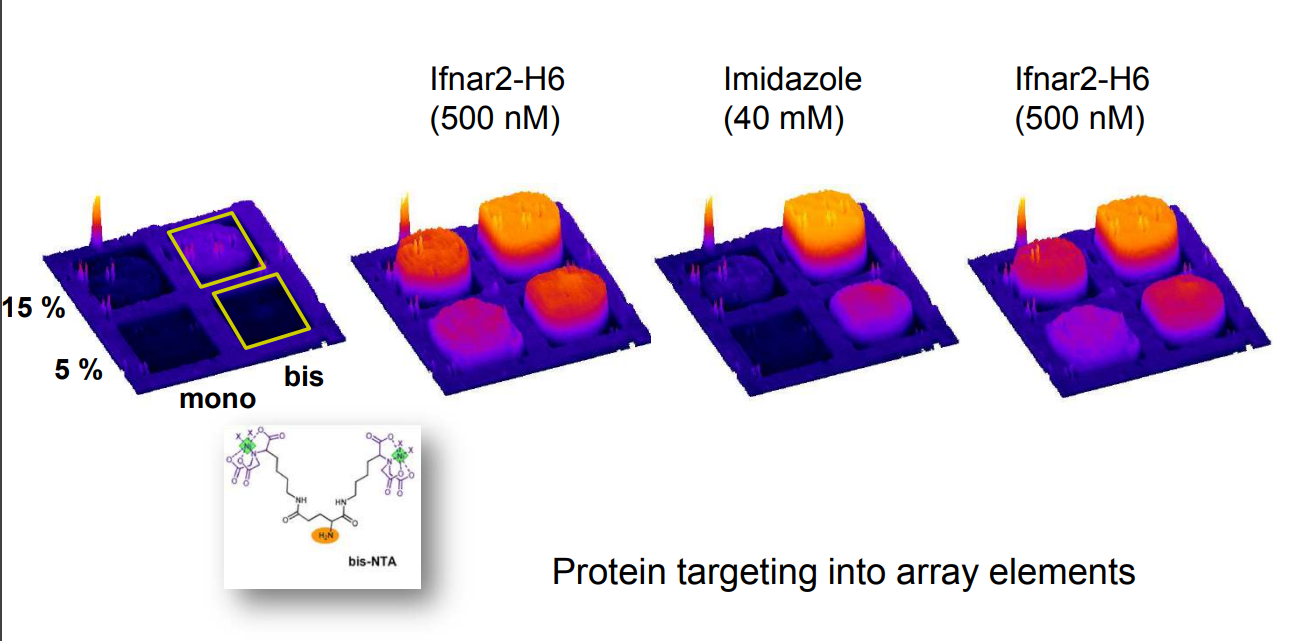
Multivalent chelator head group
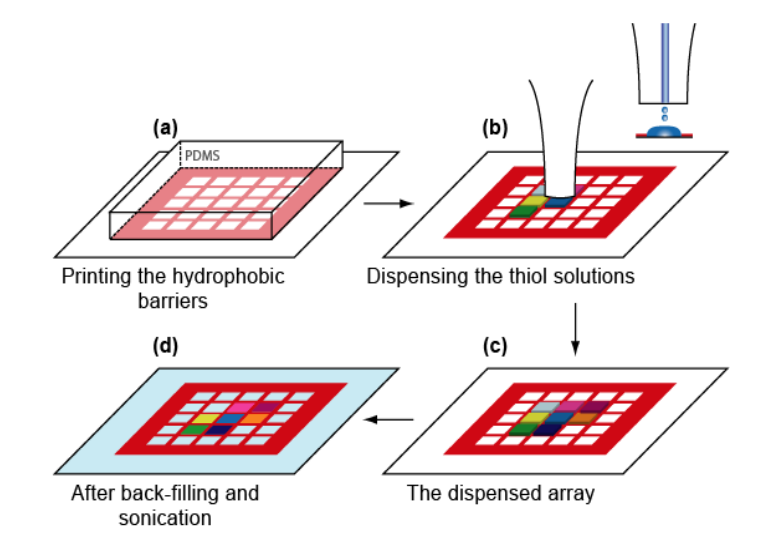
Microstructured functional protein arrays
µ-contact printing combined with piezo-dispensing
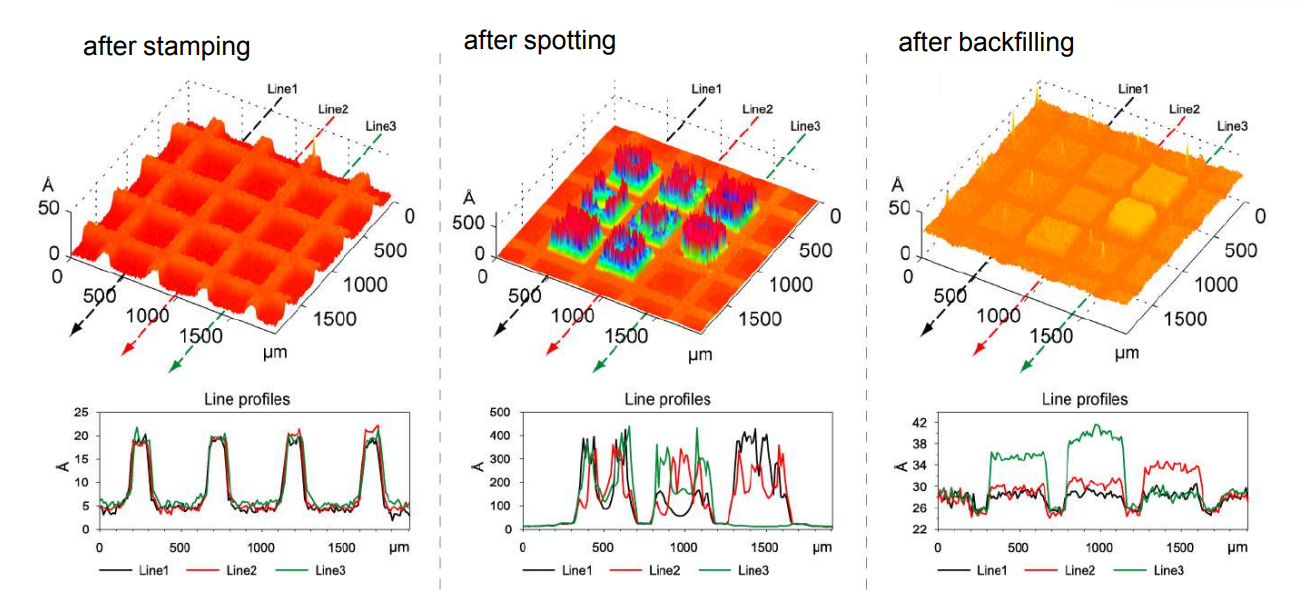
Thickness maps
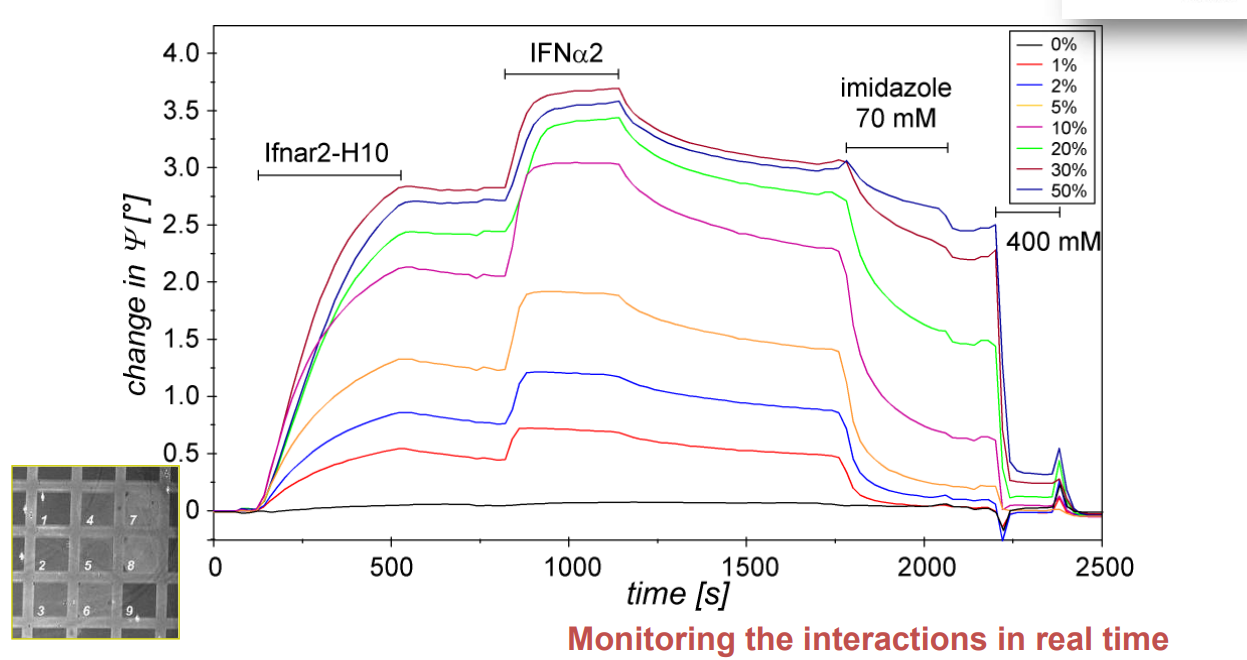
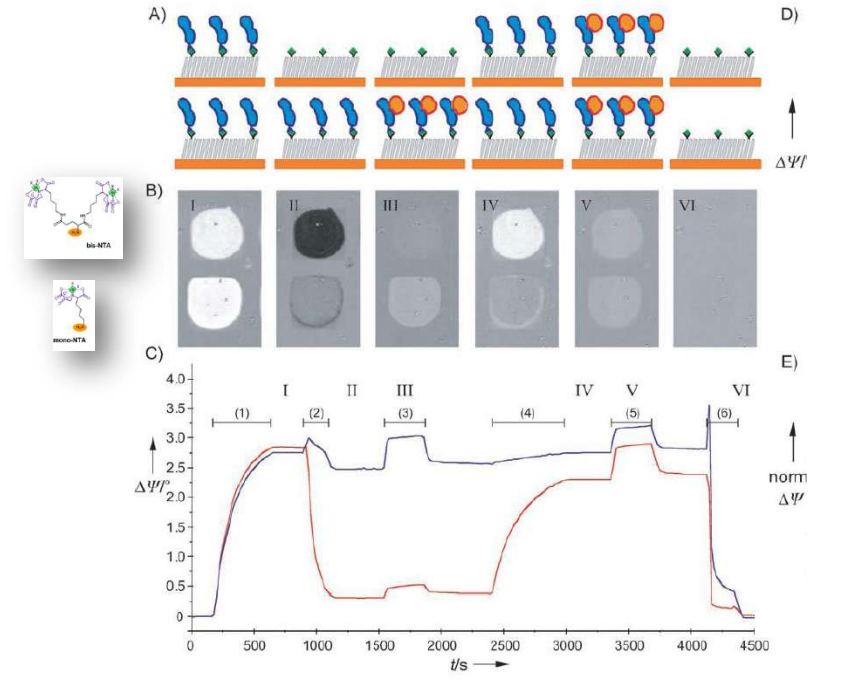
Spotted bis-NTA density array (0, 1, 2, 5, 10, 20, 30 and 50 mol% in matrix)
Immobilization of ifnar2-H10 and ligand binding
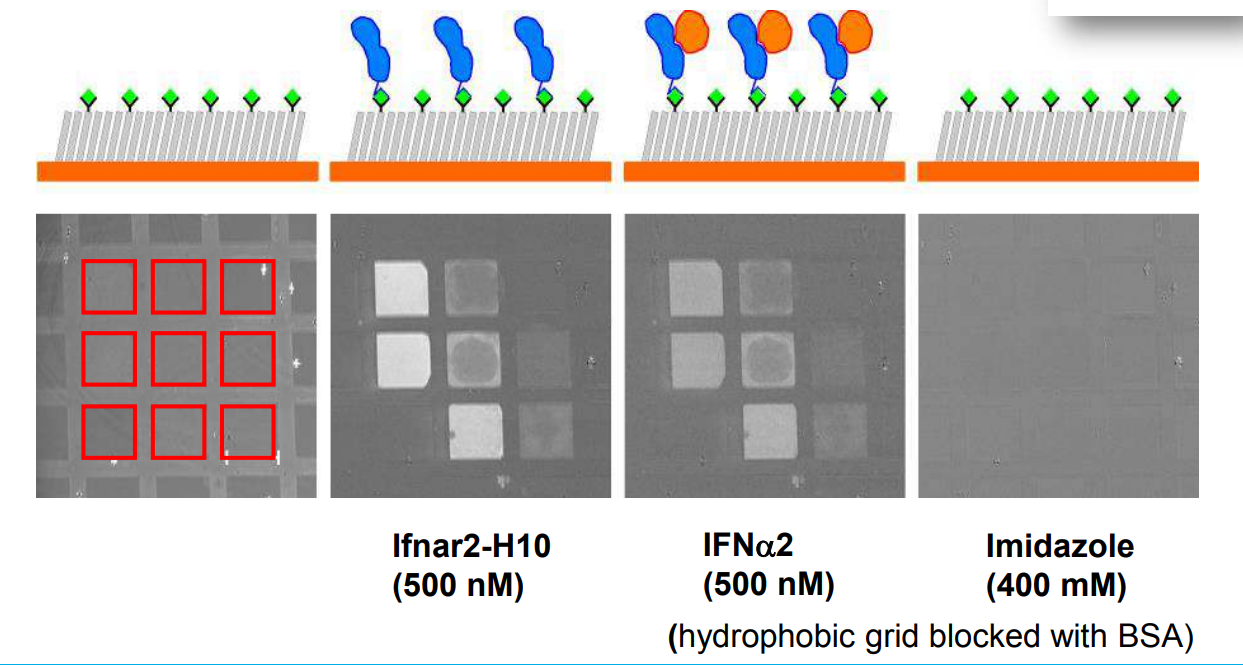
Bis-NTA density array, SPR imaging
mono- and bis-NTA density array
mono- and bis-NTA density array
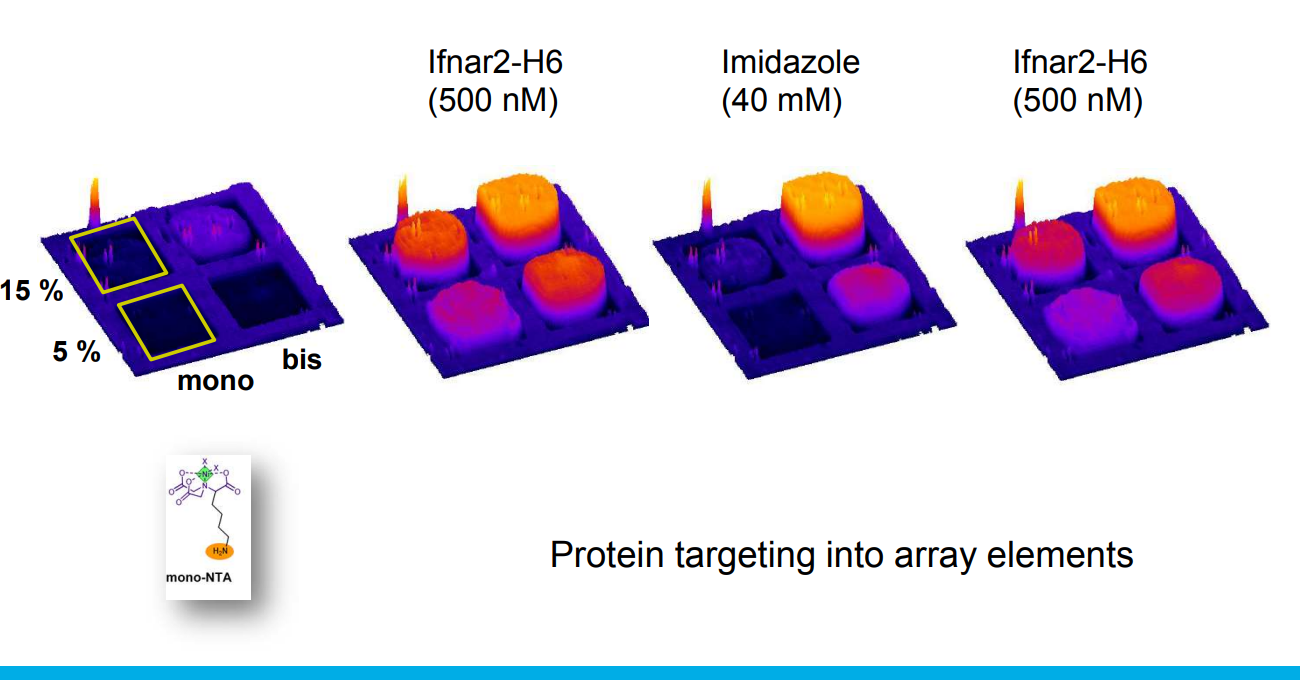
mono- and bis-NTA density array
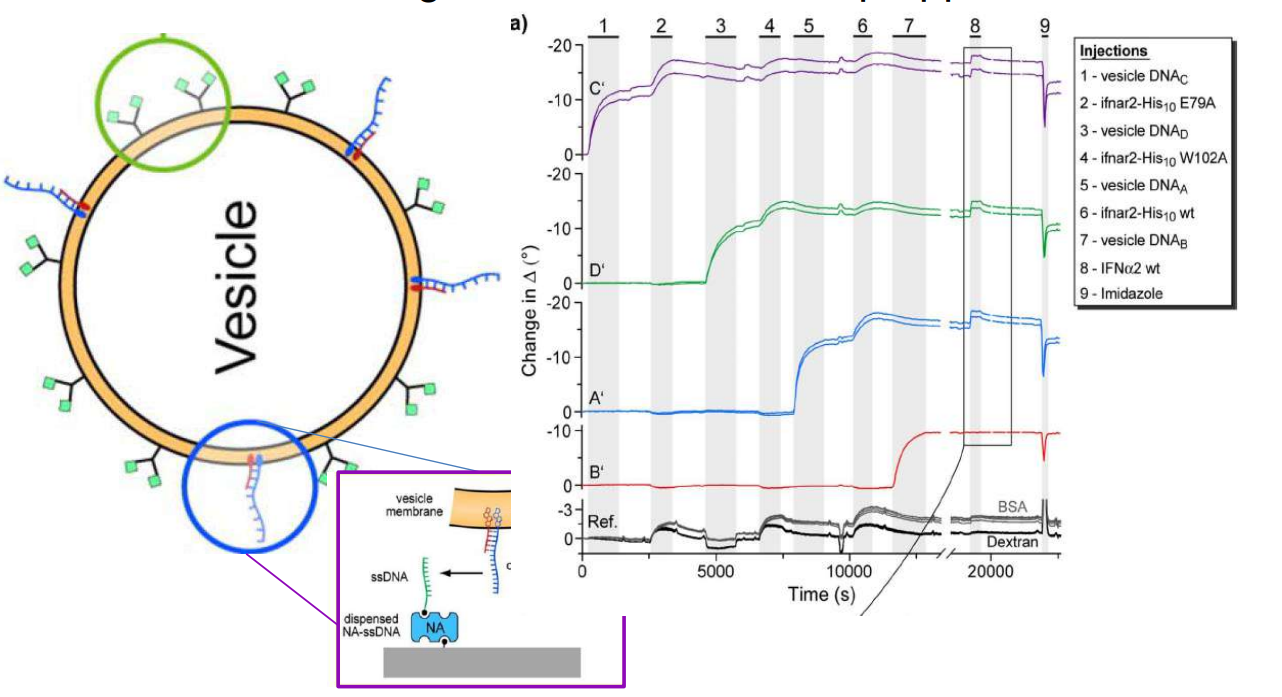
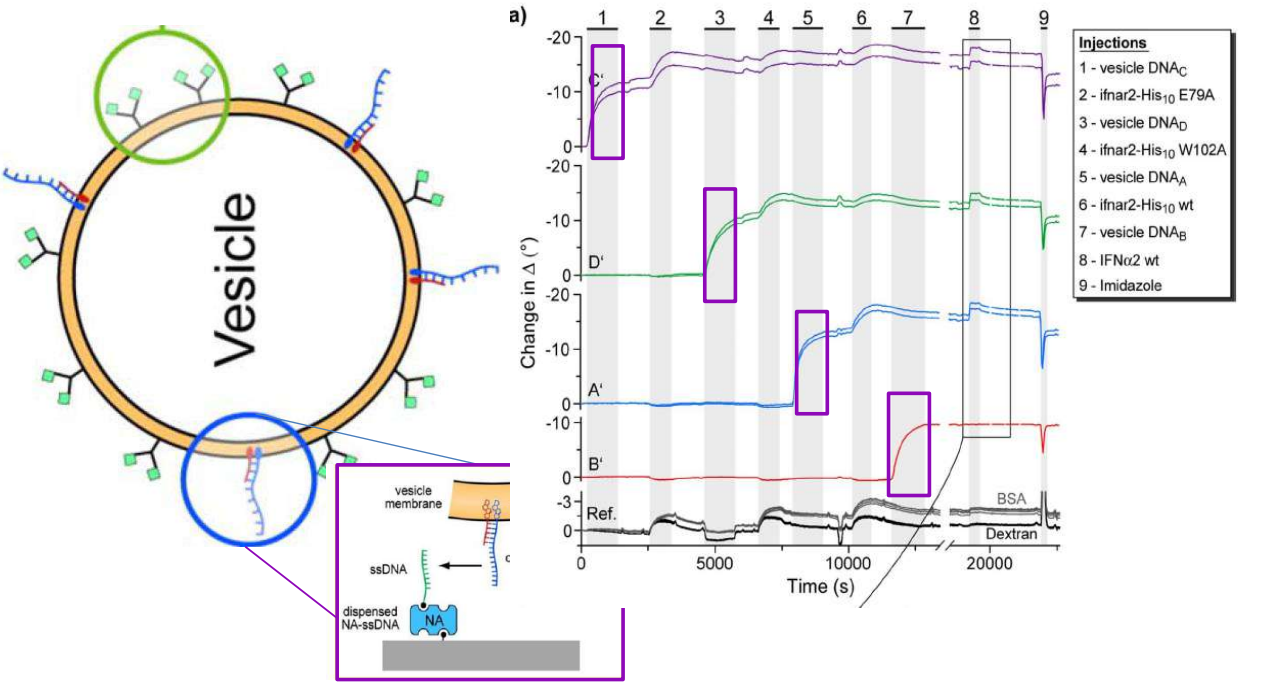
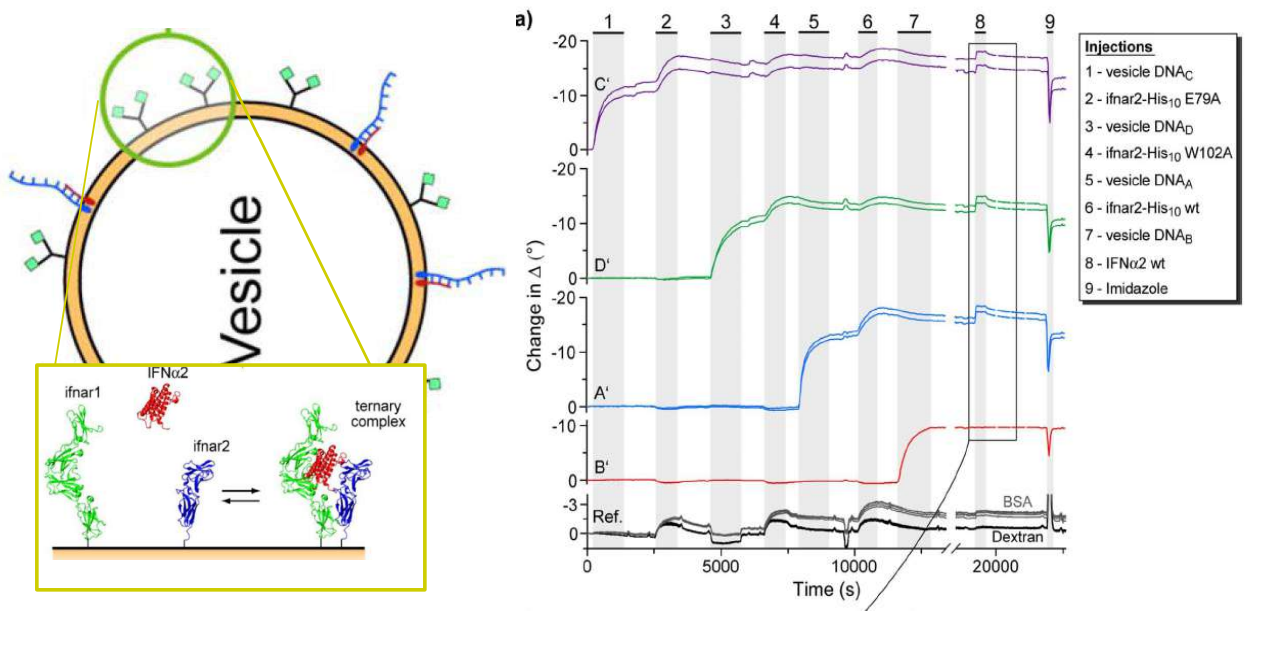
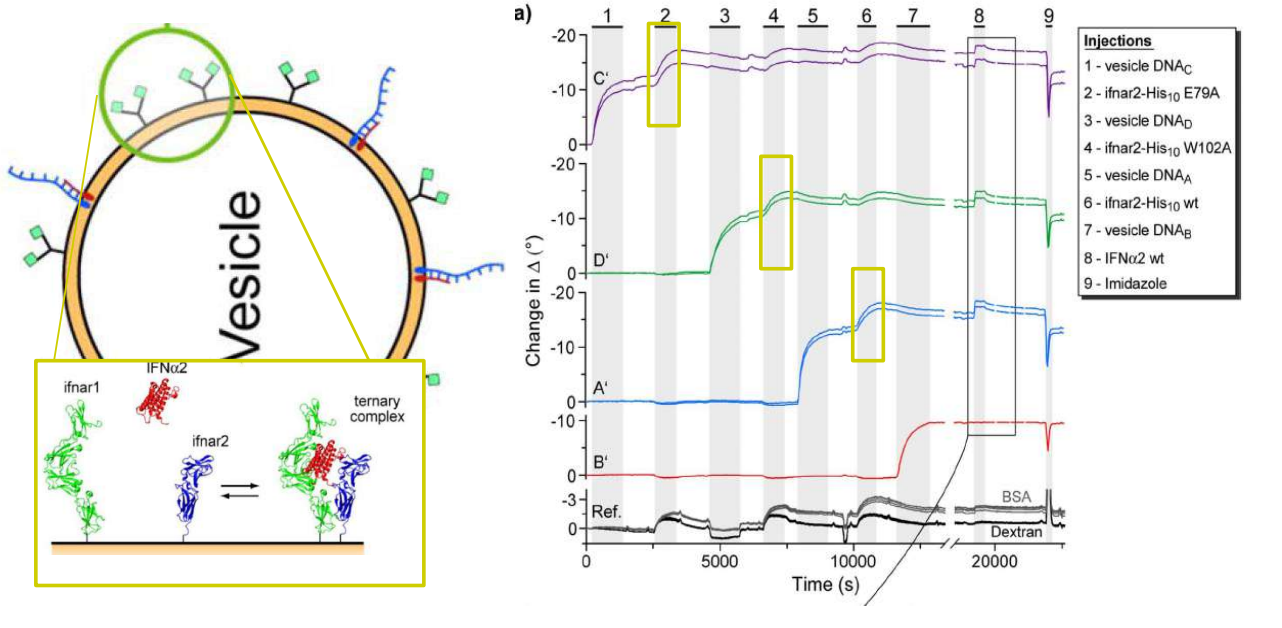
DNA – bar-coding of vesicles for bio chip application
<Klenkar G, Brian B, Ederth Th, Stengel G, Höök F, Piehler J, Liedberg B (2008) Biointerphases 3: 29-37.>
DNA – bar-coding of vesicles for bio chip application
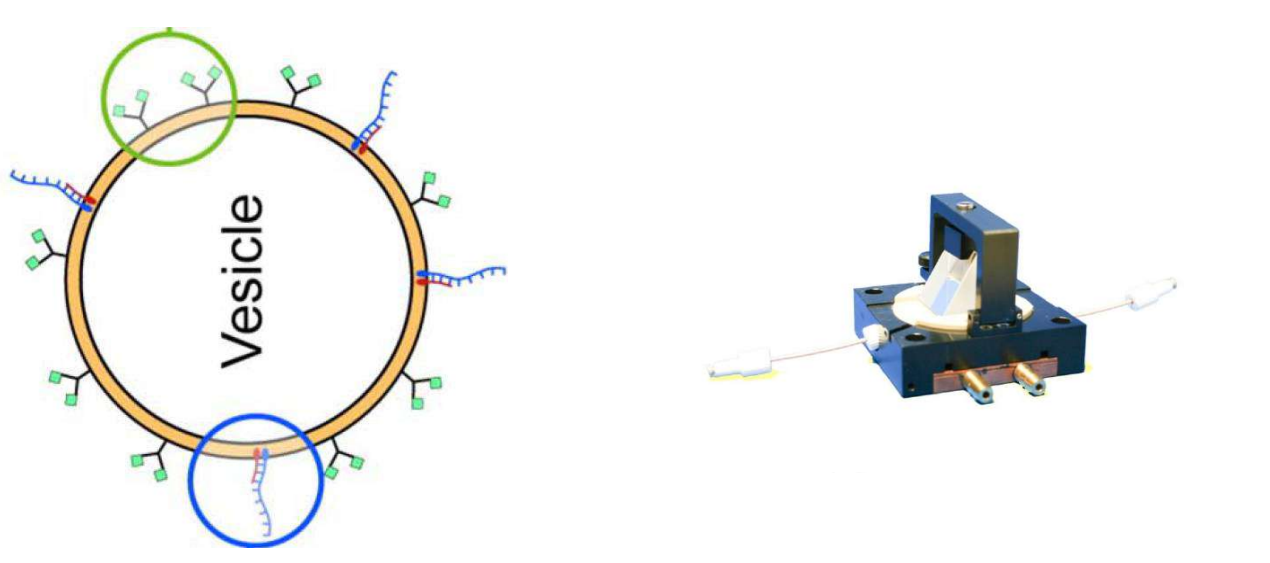
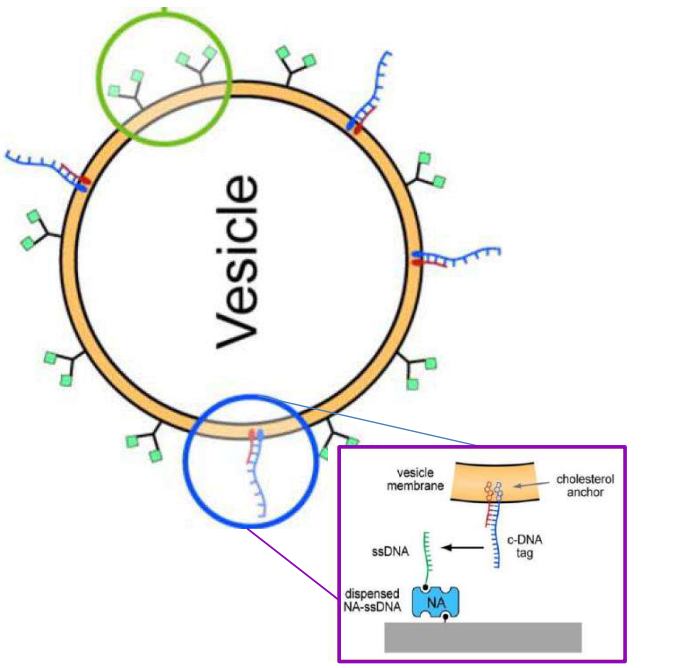
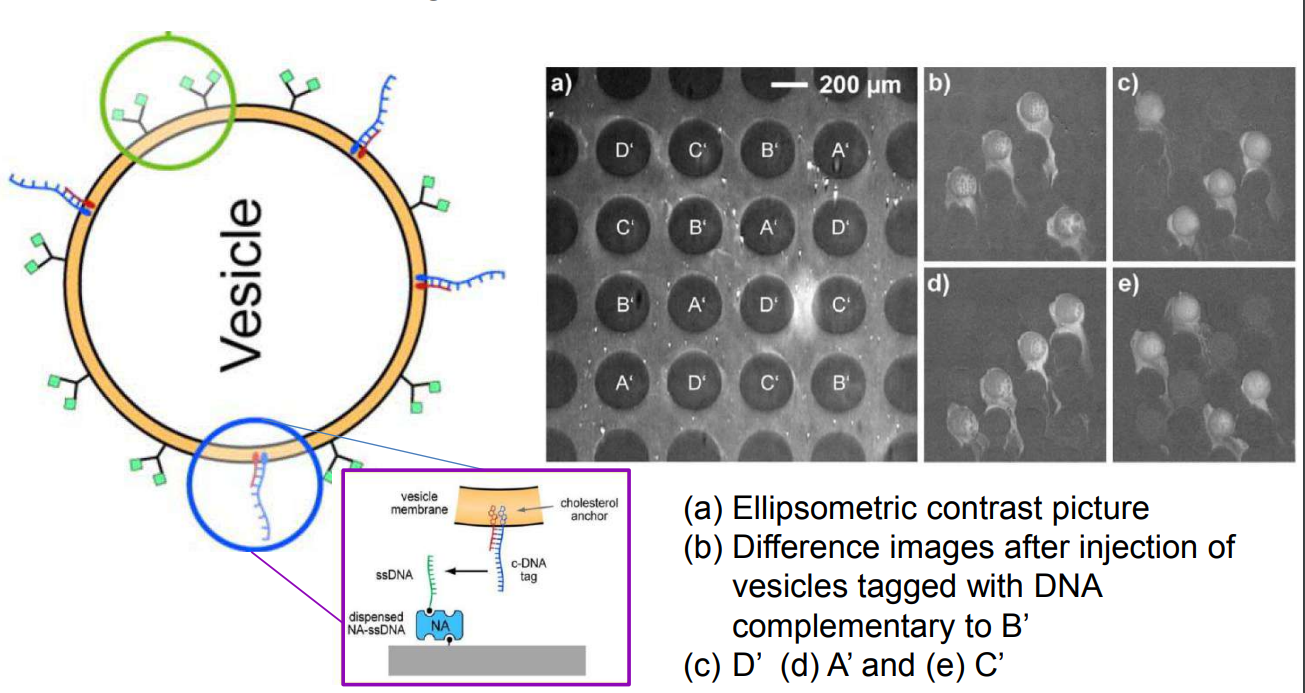
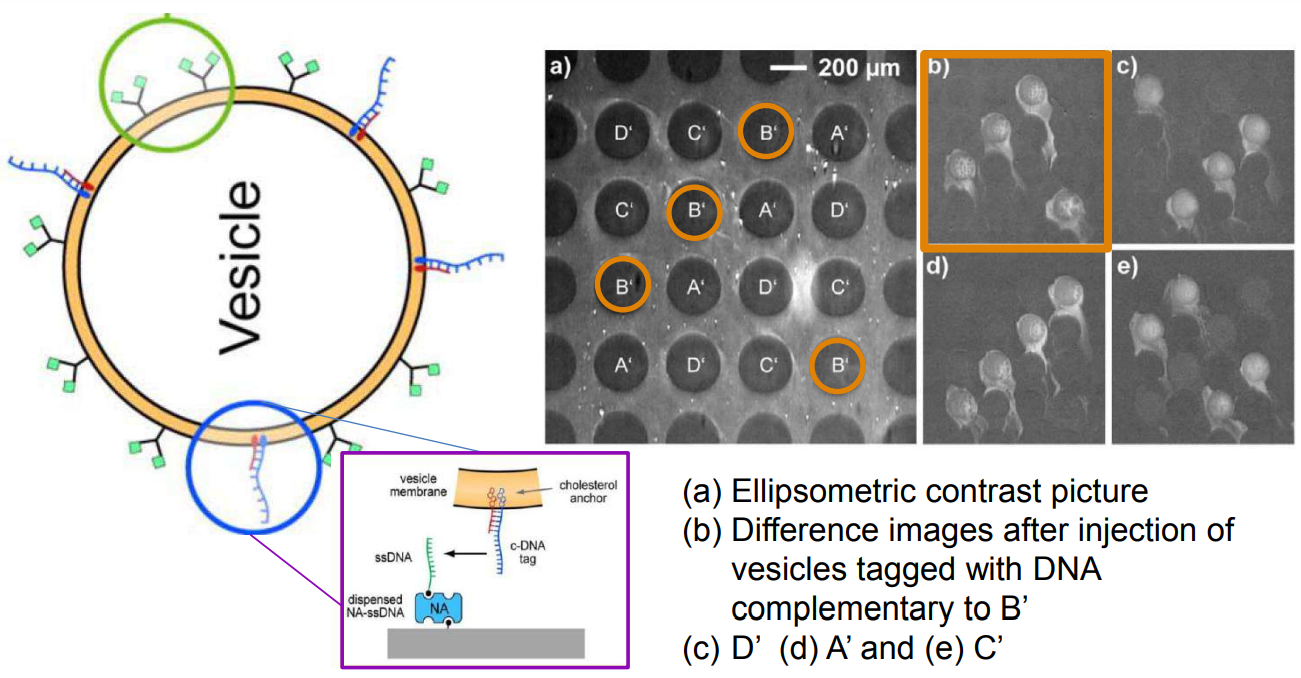
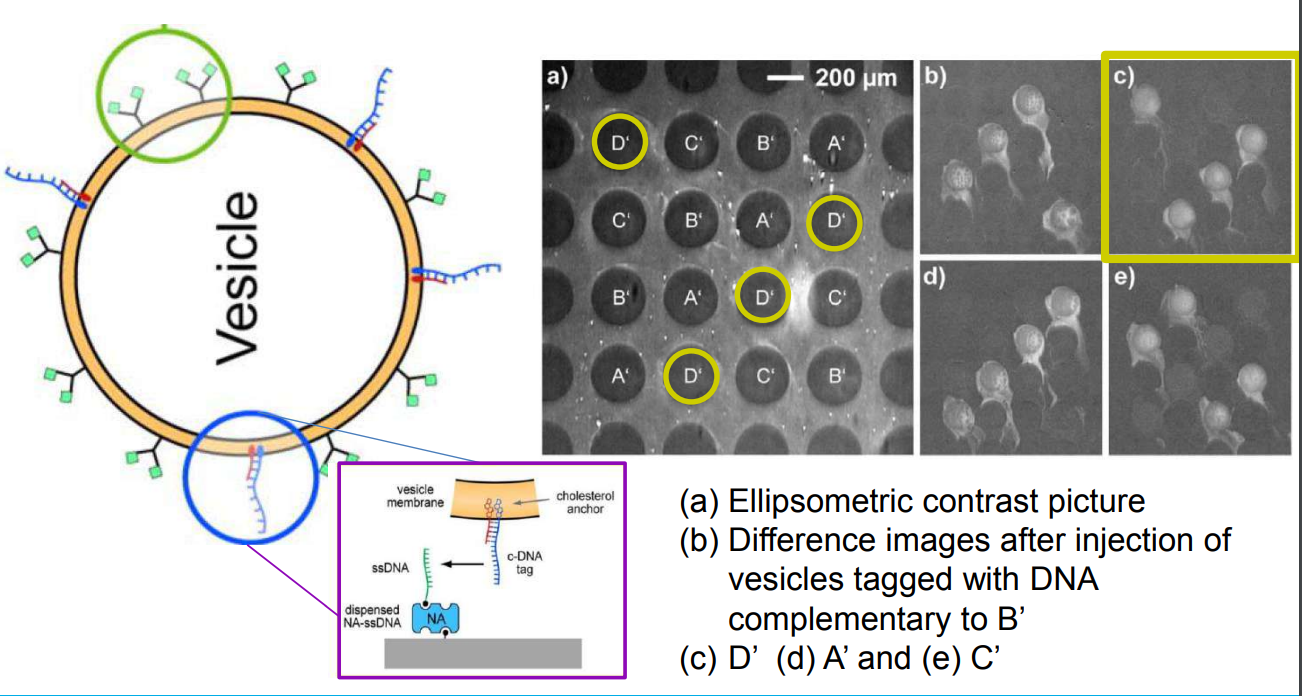
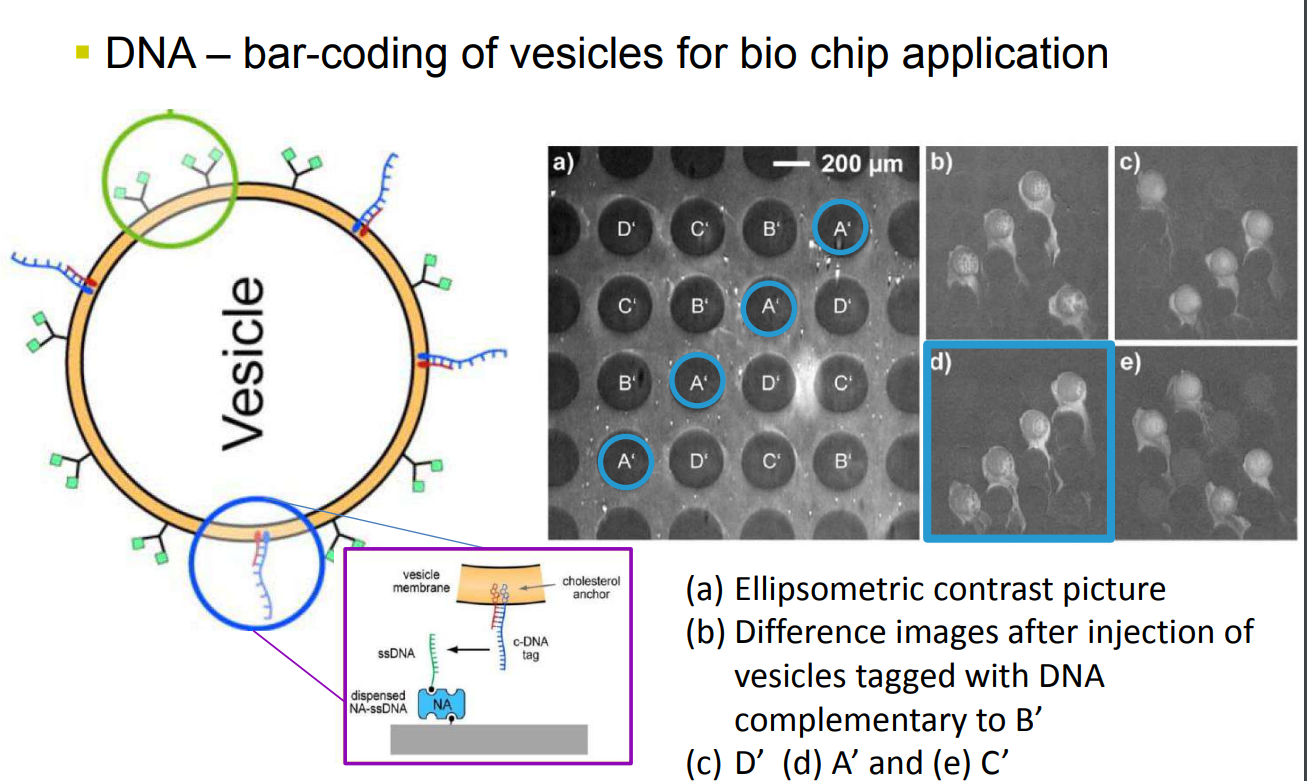
Time dependency, adsorption kinetics, biomolecular interaction
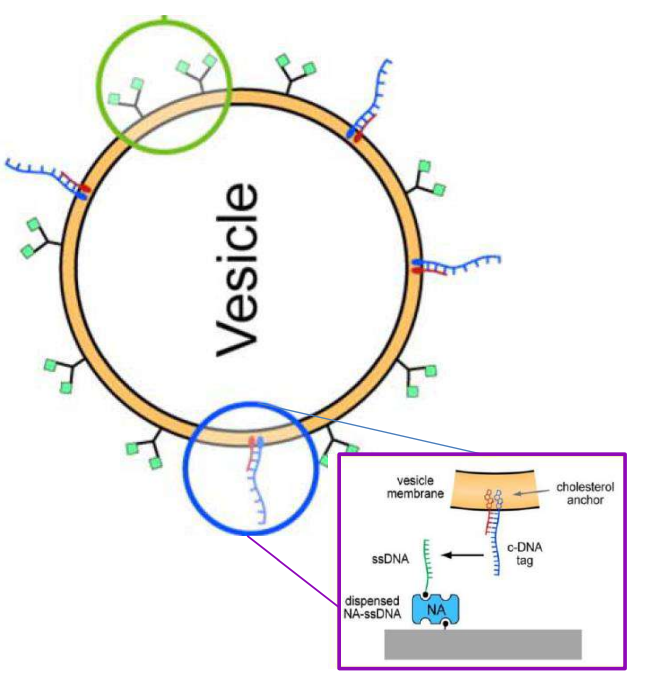
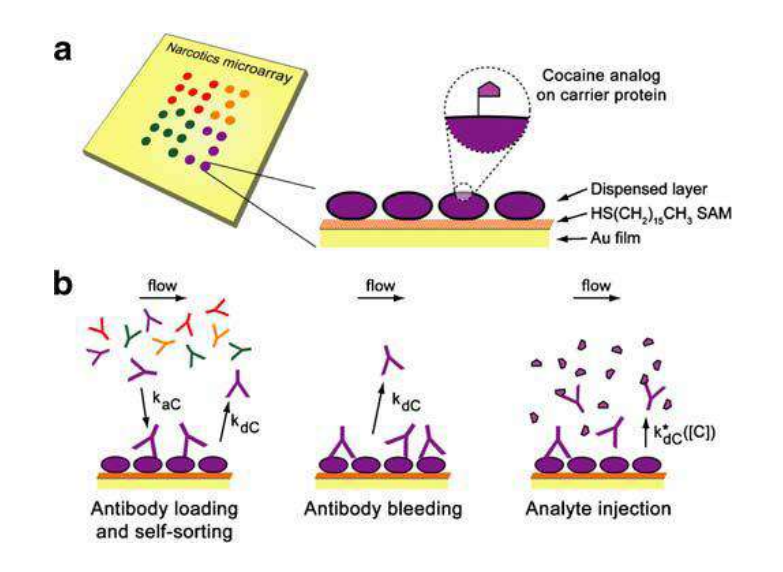
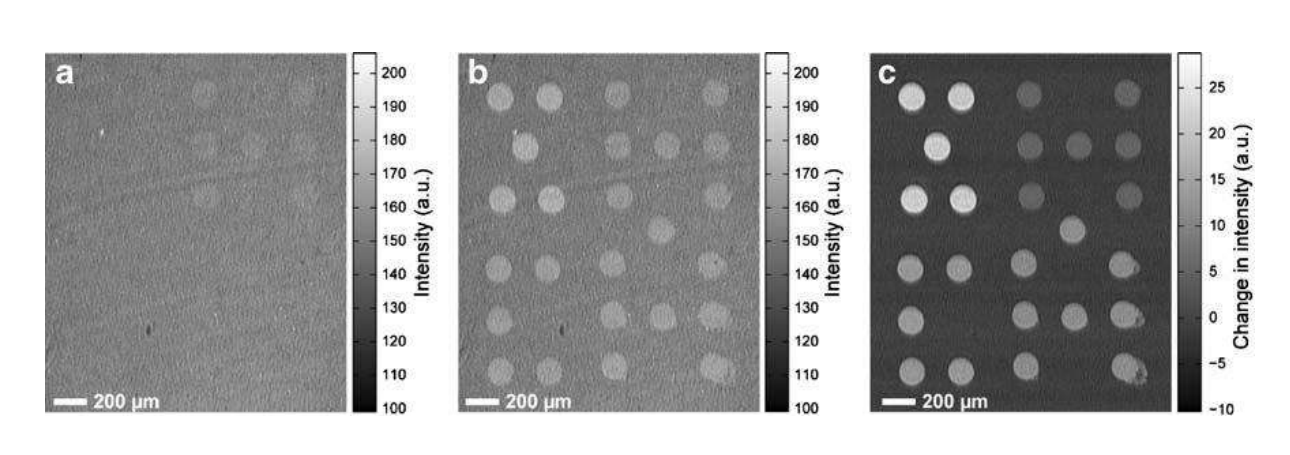
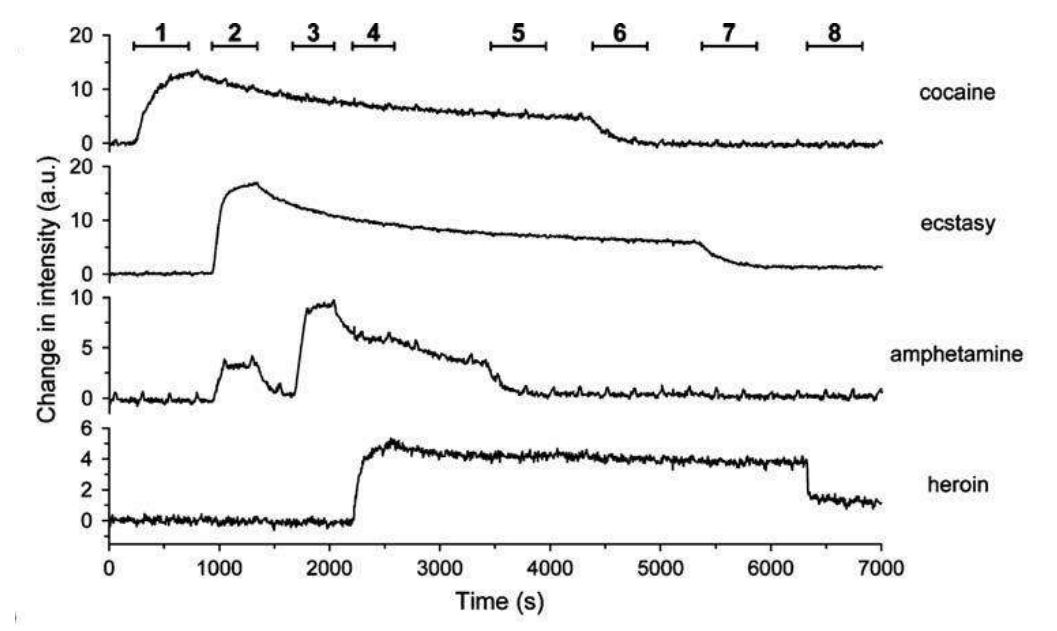
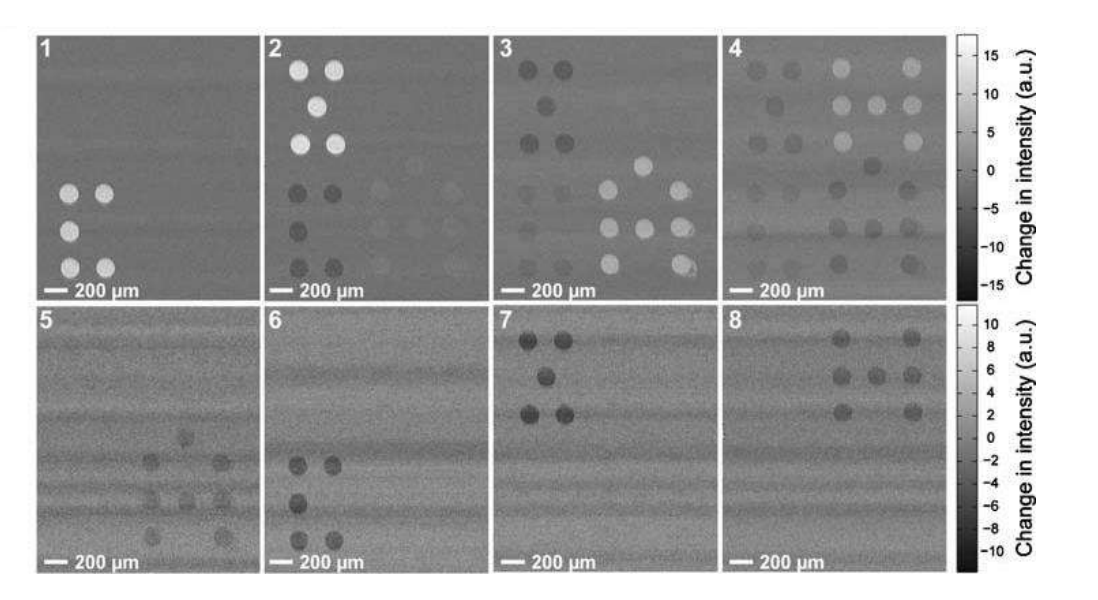
A microarray chip for label-free detection of narcotics
<Klenkar G, Liedberg B (2008) Anal Bioanal Chem 391:1679–1688.>
Characterization of physical properties of supported phospholipid membranes
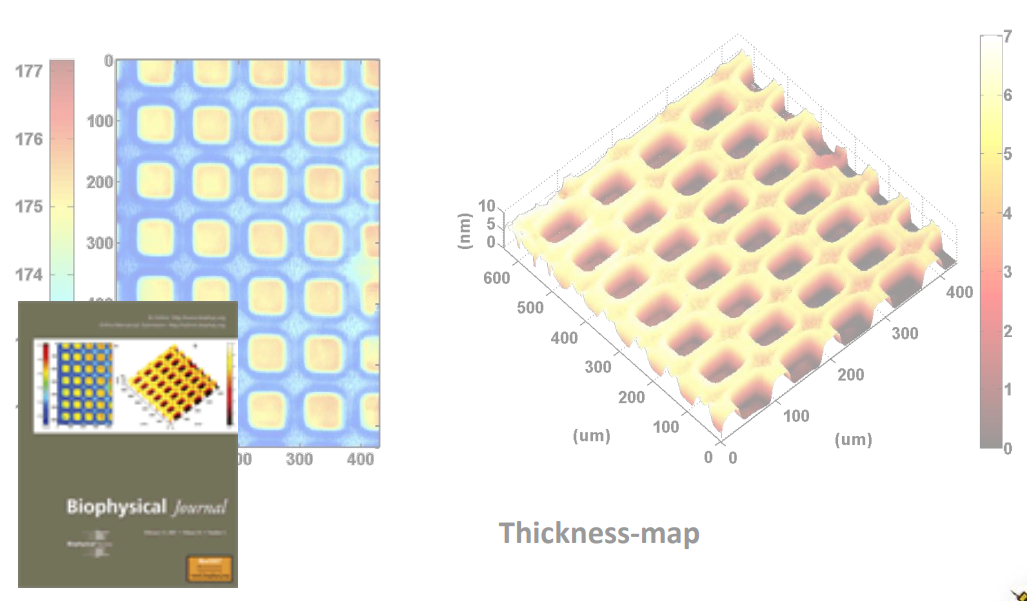
<HOWLAND MC, SZMODIS AW, SANII B, PARIKH AN. (2007) Characterization of physical properties of supported phospholipid membranes using imaging ellipsometry at optical wavelengths. Biophys J. 92, 1306-17>
Supported lipid bilayer
A lipid bilayer is a thin polar membrane made of two layers of lipid molecules. These membranes are flat sheets that form a continuous barrier around cells. The lipid bilayer is one of the most important self-assembled structures in nature.
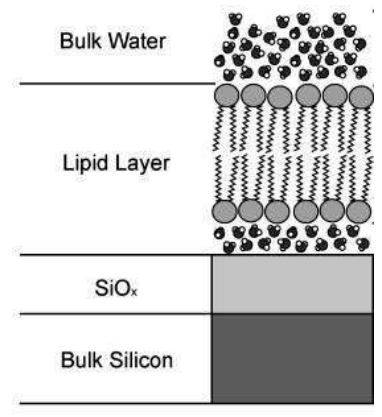
Solid supported lipid bilayers are an excellent model system for studying the surface chemistry of membranes and cell. A wide variety of surface-specific analytical techniques can be used to investigate processes such as cell signaling, ligand–receptor interactions or enzymatic reactions occurring at the cell surface
Photopattern of supported phospholipid membrane
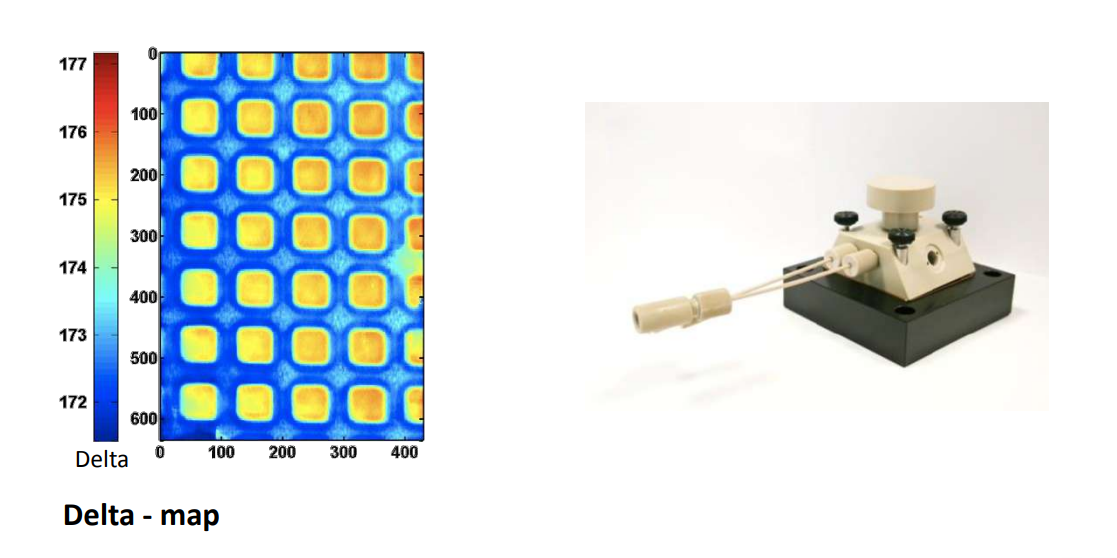
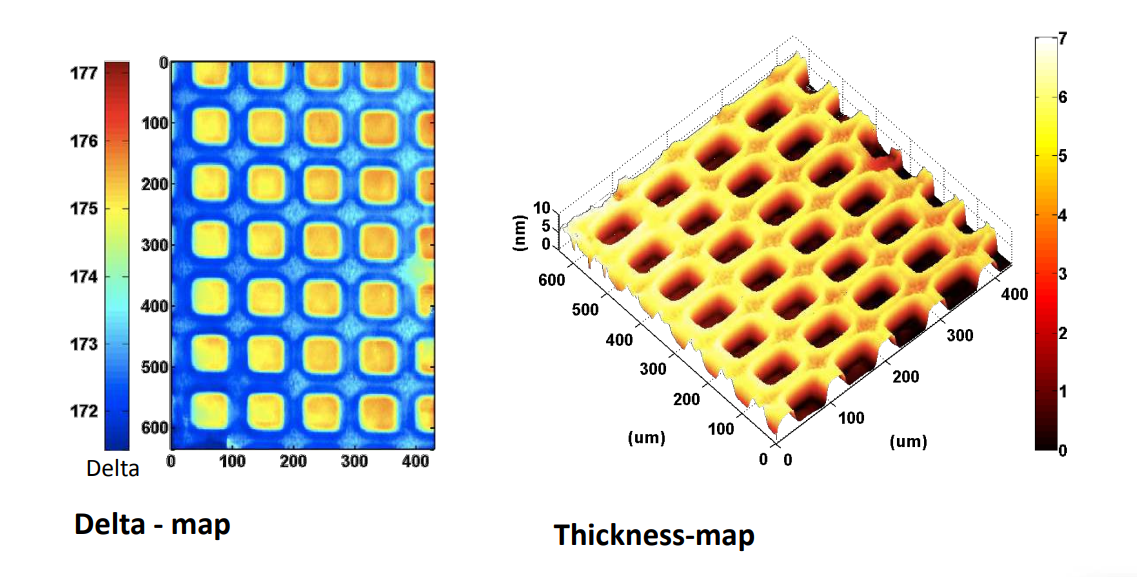
Biomolecular interaction at model membranes
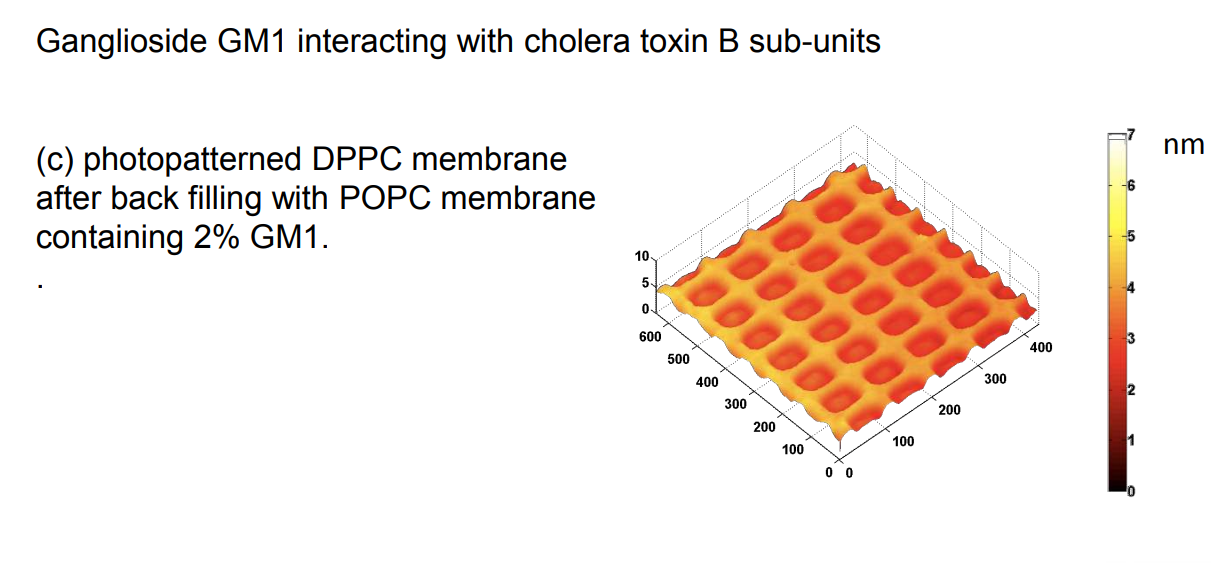
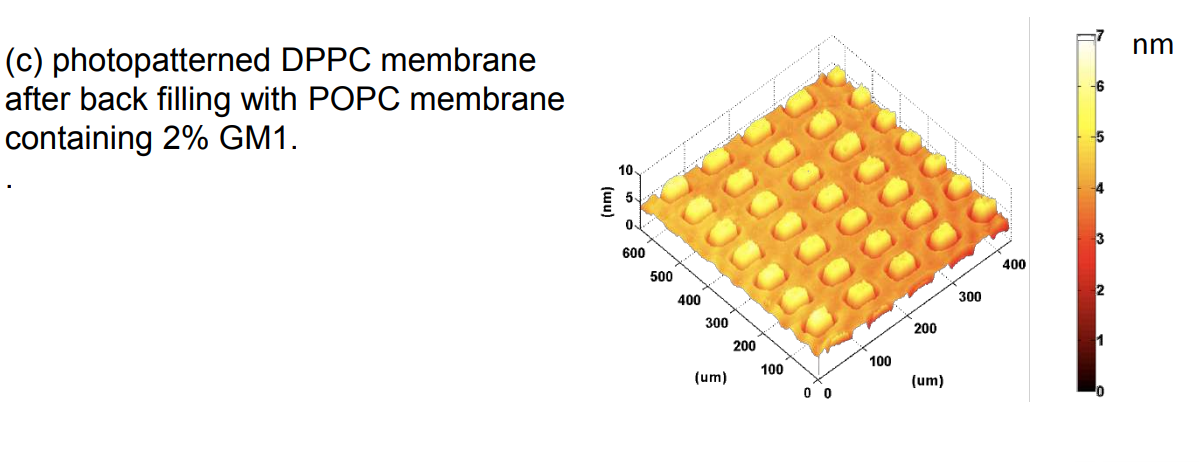
Ganglioside GM1 interacting with cholera toxin B sub-units
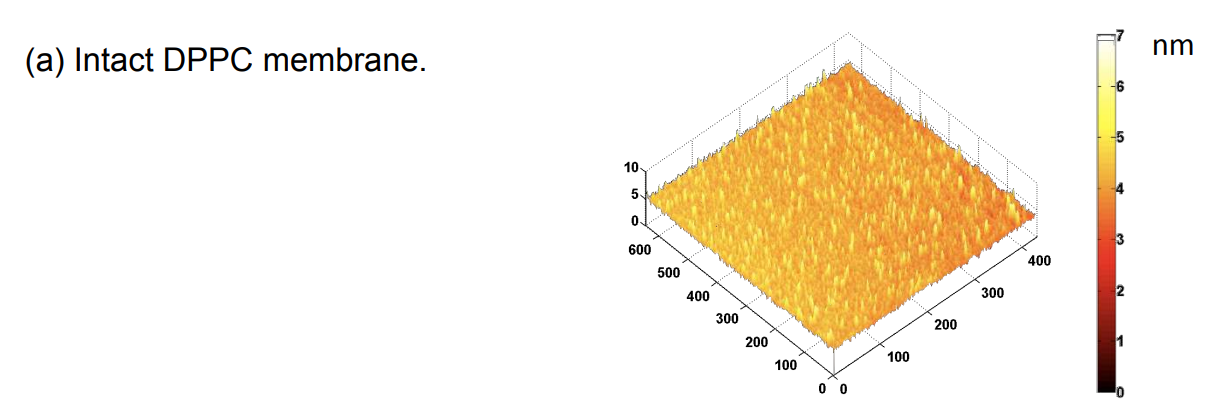
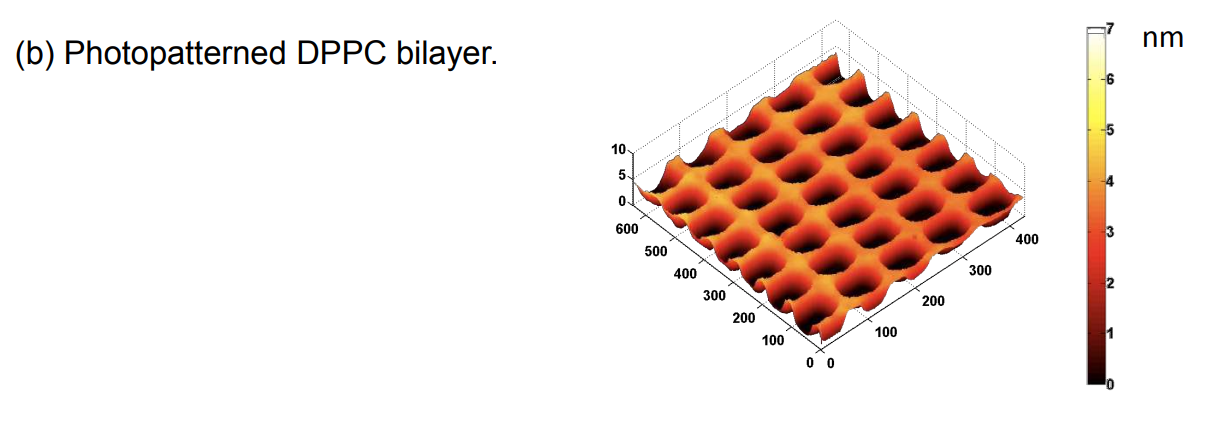
DPPC = 1,2-Dipalmitoyl-sn-Glycero-3-Phosphocholine
Endpoint analysis via Imaging SPREE (high density protein arrays, >2500 spots, label-free, in situ)
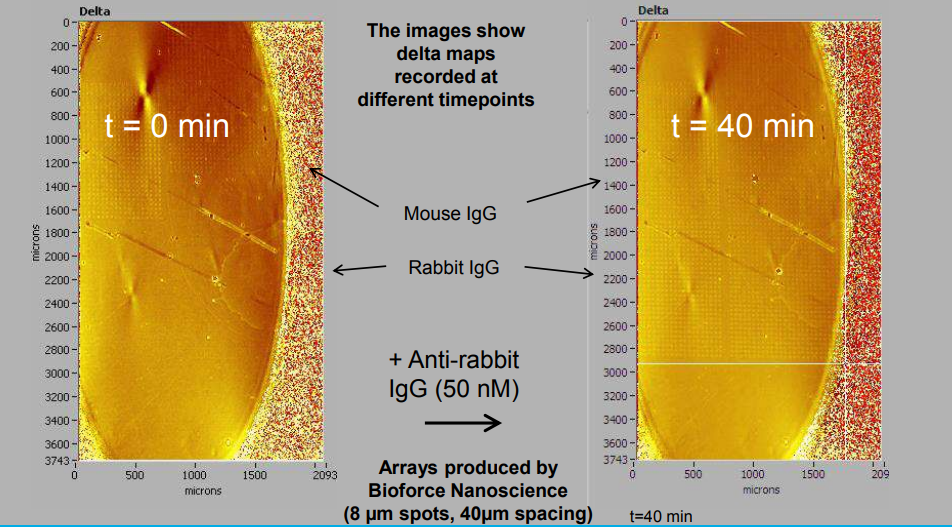
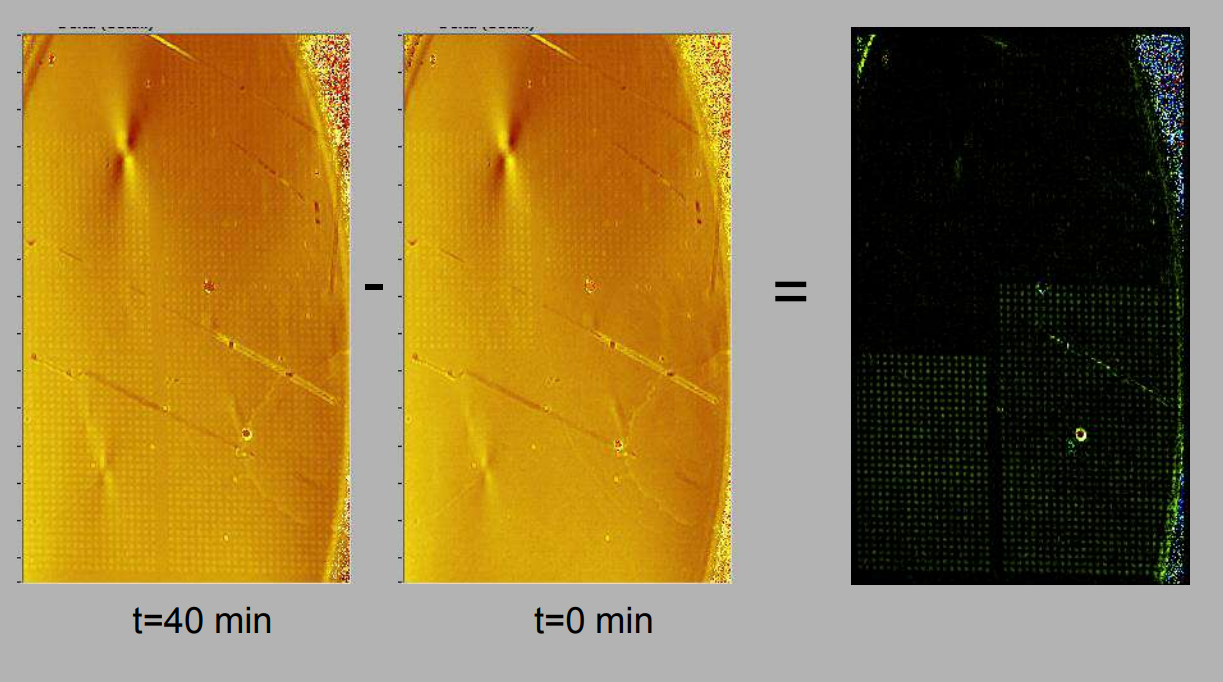
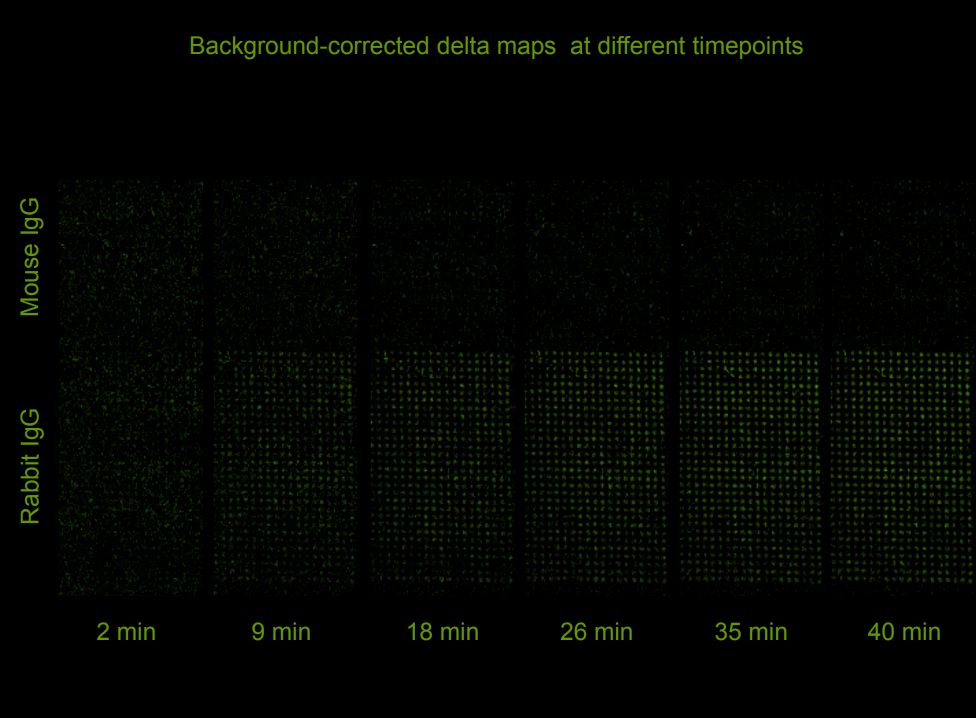
Quality control of protein micro arrays
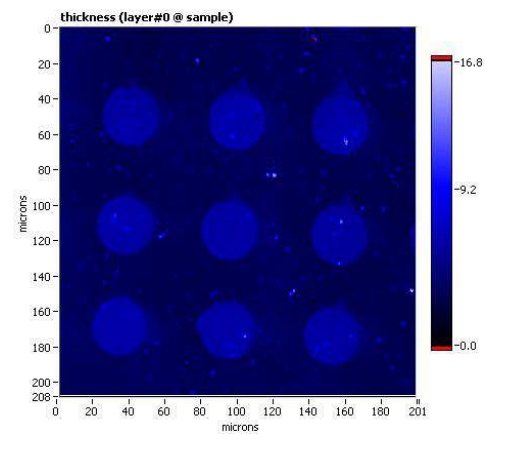
Quality control of protein spots (micro array)
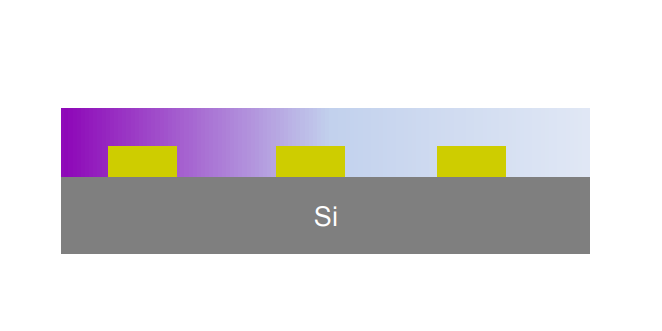

Ellipsometric contrast micrograph

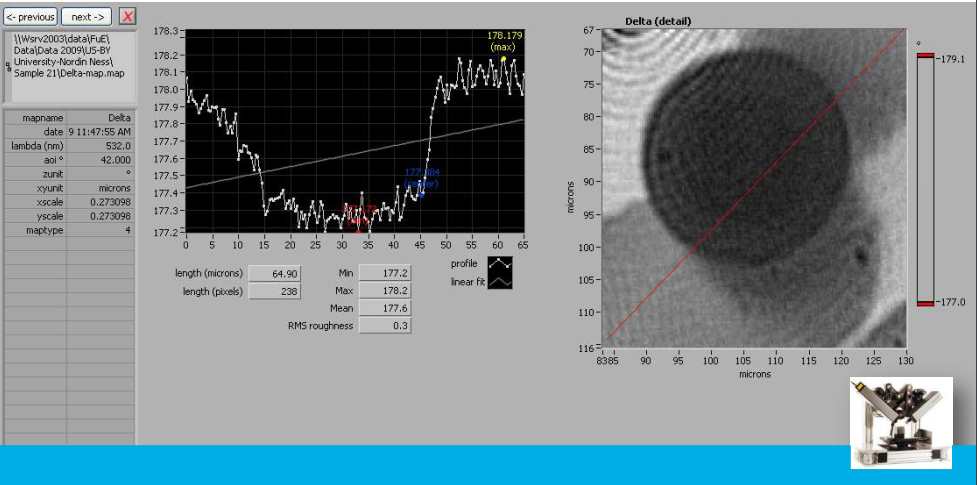
Delta map
Delta map: digital zoom
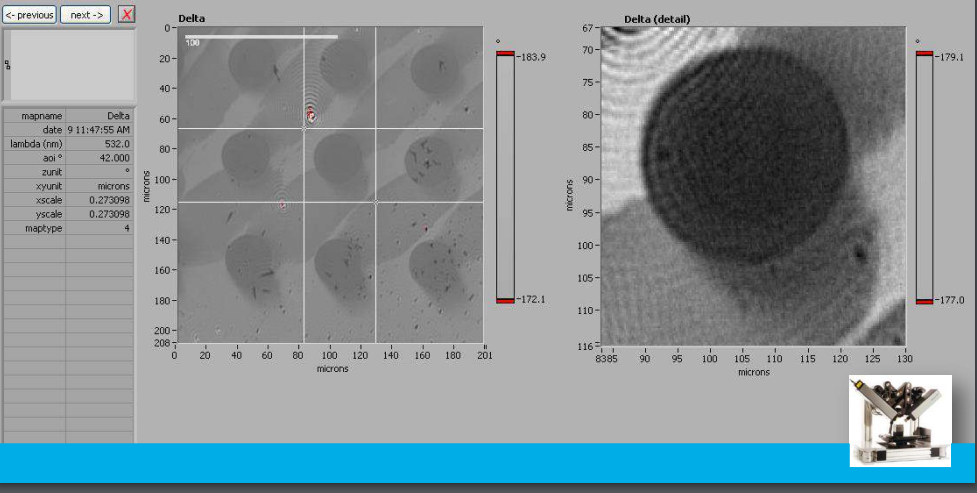
Delta map: profil
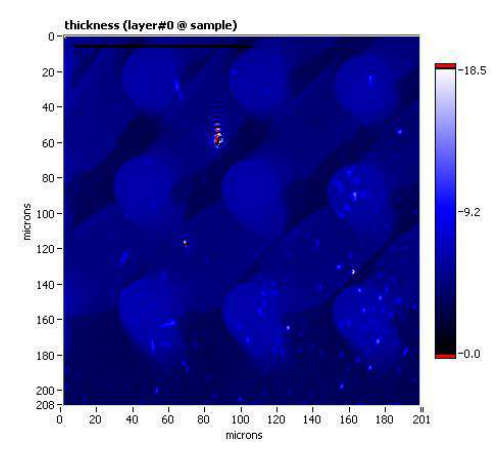
Thickness map, sample A
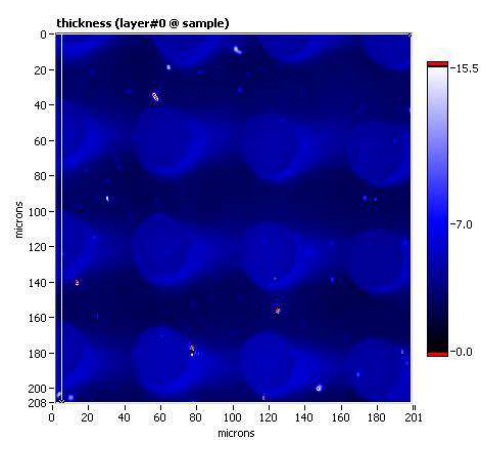
Thickness map, sample B
new cells and accessories
nanofilm_microlab
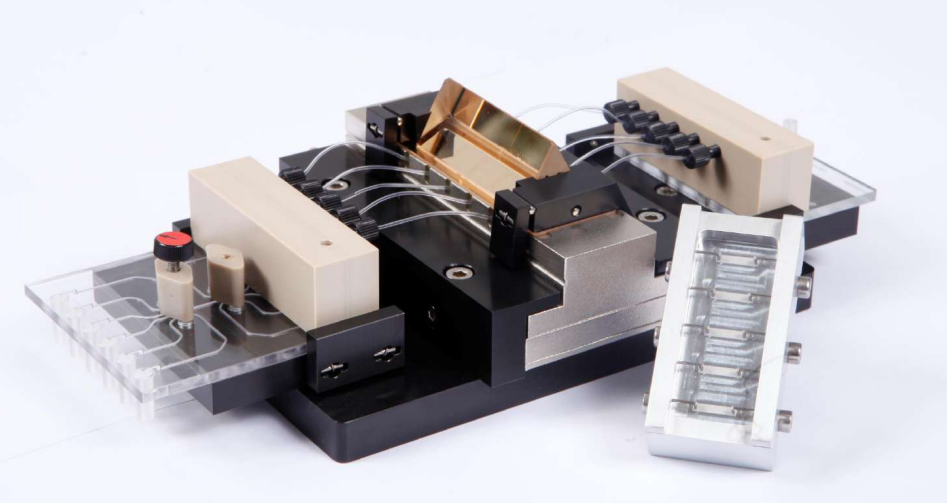
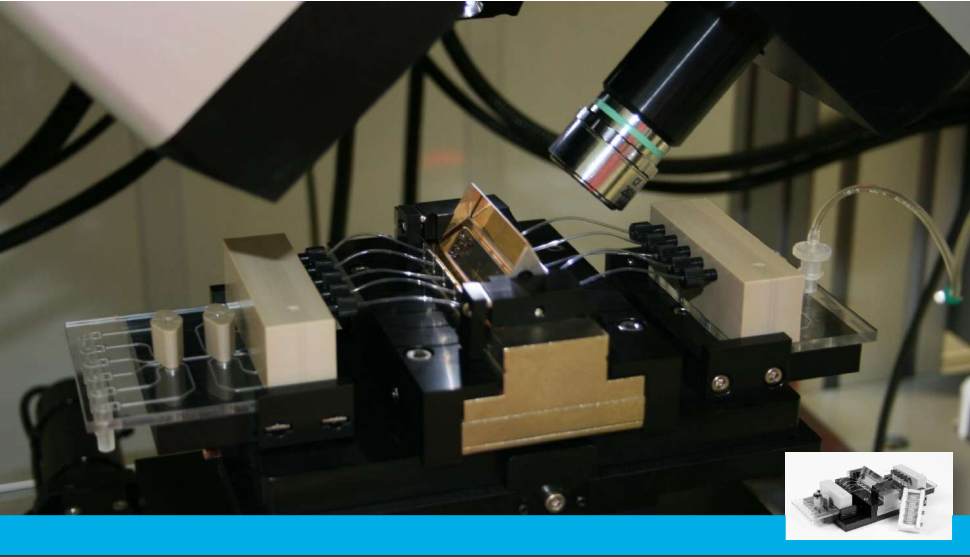
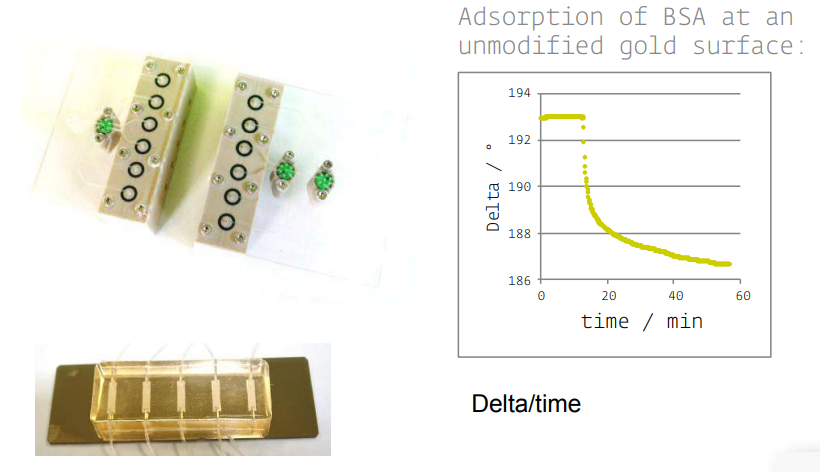
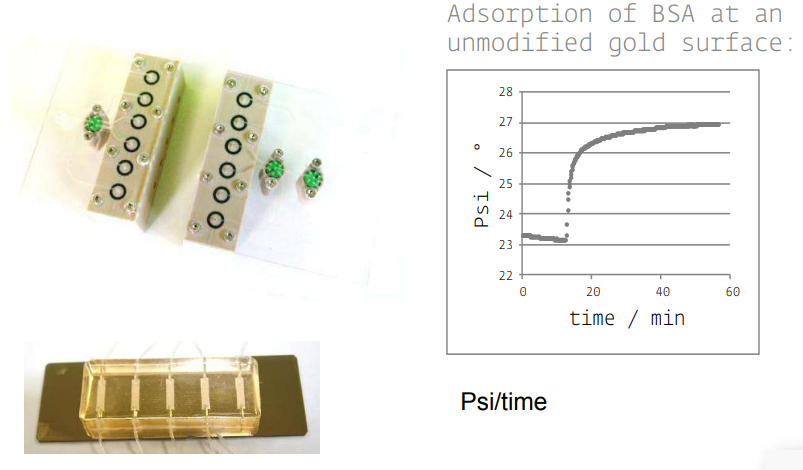
Instrumentation
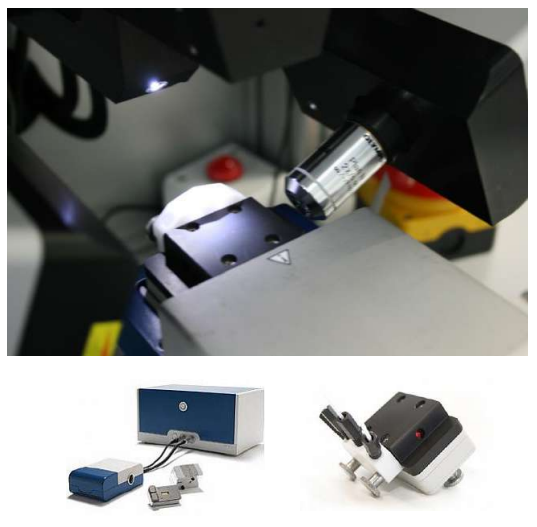
The new imaging ellipsometer
Nanofilm_EP4
A modular platform allows us building the instrument according to your Scientific needs!
Start your experiences with imaging ellipsometry with the single wavelength version.
Technical Integration with QCM-D from Q-Sense
The new instrument offers a broad range of Unique features!
Accessories
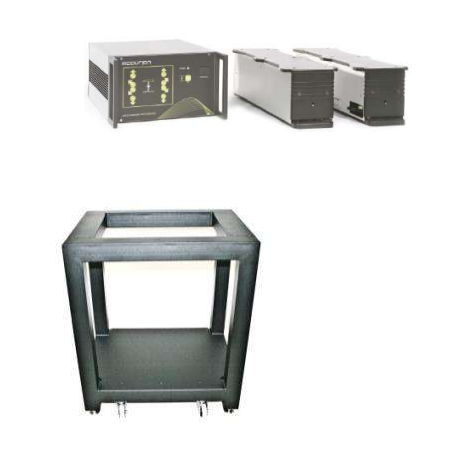
Active vibration isolation halyconics_variobasic_40 Supportframe halcyonics_bam/ie
Accessories imaging SPR in the ellipsometric mode
• KineticSPR cell
• Microfluidic

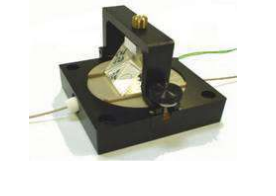
Accessories in situ
• Various S/L cells
• Temperatur control
• Liquid handling
• Electrochemistry upgrades
